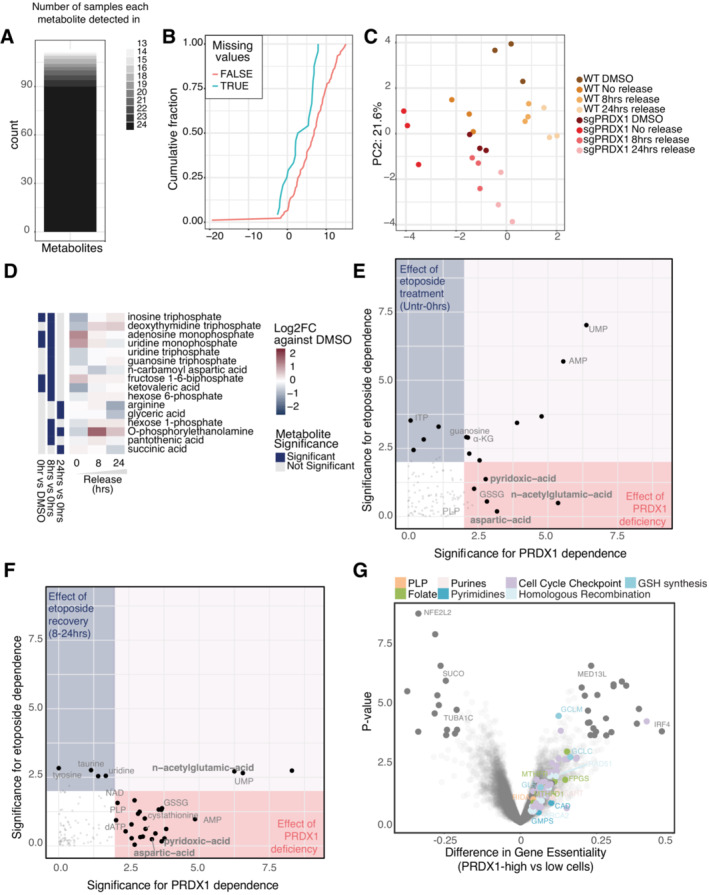
Figure EV6. Etoposide‐release metabolomics.

-
ANumber of metabolites detected per sample in the targeted metabolomics experiment.
-
BDistribution of intensities of consistently detected‐ and partially detected metabolites showing an intensity‐dependent detection pattern.
-
CPCA plot for all samples in the metabolomics experiment.
-
DSignificantly affected metabolites due to etoposide treatment and 24‐h release in U2‐ OS sgPRDX1 cells.
-
E, FPRDX1 deficiency‐dependency and etoposide treatment‐dependency of analyzed metabolites, based on linear regression analysis on the Untreated – 0 h (E) and 8–24 h release timepoints (F).
-
GDifferential gene essentiality between high and low PRDX1‐expressing cell lines (CCLE) as in the Achilles dataset. Cell lines with low PRDX1 expression are significantly more sensitive to the depletion of genes represented in the right part of the x‐axis as compared to cell lines with high PRDX1 expression.
