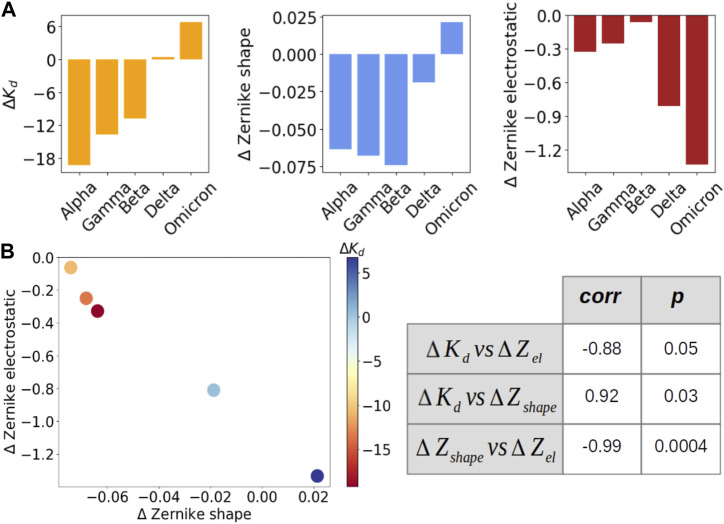
FIGURE 3.
Evaluation of the correlation between dissociation constant and shape and electrostatic complementarity for five VOCs. (A) From left to right: ΔK d , ΔZ s and ΔZ el for five VOCs (alpha, gamma, beta, delta, omicron). The variants are ordered according to their dissociation constant value. (B) On the left, ΔZ el as a function of ΔZ s for each of the five VOCs. Each point is colored according to the ΔK d value of that variant, as indicated by the color bar. On the right, the correlation (first column) and Pearson (second value) value between the three quantities are presented in (A).

