Figure 3.

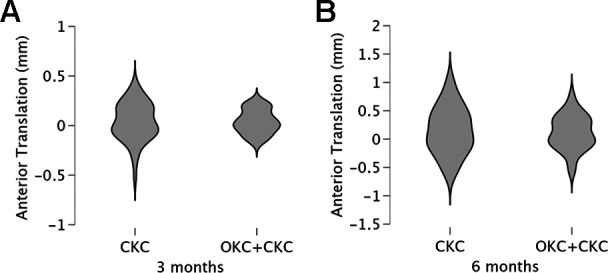
Comparison of laxity at (A) 3 and (B) 6 months in the intervention and control groups (the width of the plots indicates the frequency with which these values occur). CKC, closed kinetic chain; OKC, open kinetic chain.

Comparison of laxity at (A) 3 and (B) 6 months in the intervention and control groups (the width of the plots indicates the frequency with which these values occur). CKC, closed kinetic chain; OKC, open kinetic chain.