Figure 3.
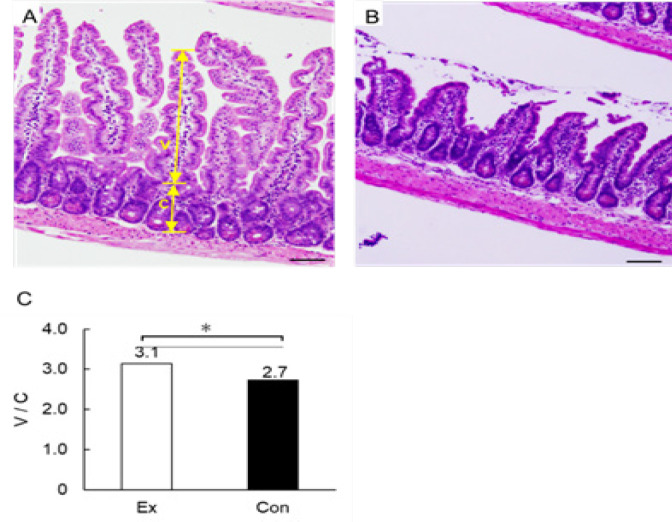
HE-Staining of the Lower Small Intestine. The photograph shows HE-stained sections of villi and submucosa of the small intestine. A shows the exercise group, whereas B shows the control group; Scale bar is 100 µm. V: villus and C: crypt. The V/C ratio was calculated as the length of villus divided by the depth of crypt. C shows and compares the V/C ratio of the lower small intestine. *, p < 0.05

