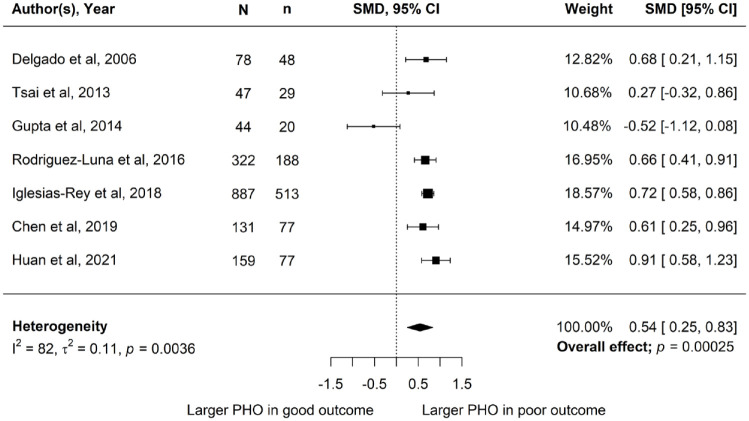
Figure 3.
Standardised mean difference in absolute perihaematomal oedema volume between poor clinical outcome (mRS score 3–6) and good outcome (mRS score 0–2) at 3 months follow-up.
N: total participants; n: participants with poor outcome; SMD: standardised mean difference; 95% CI: 95% confidence interval.

