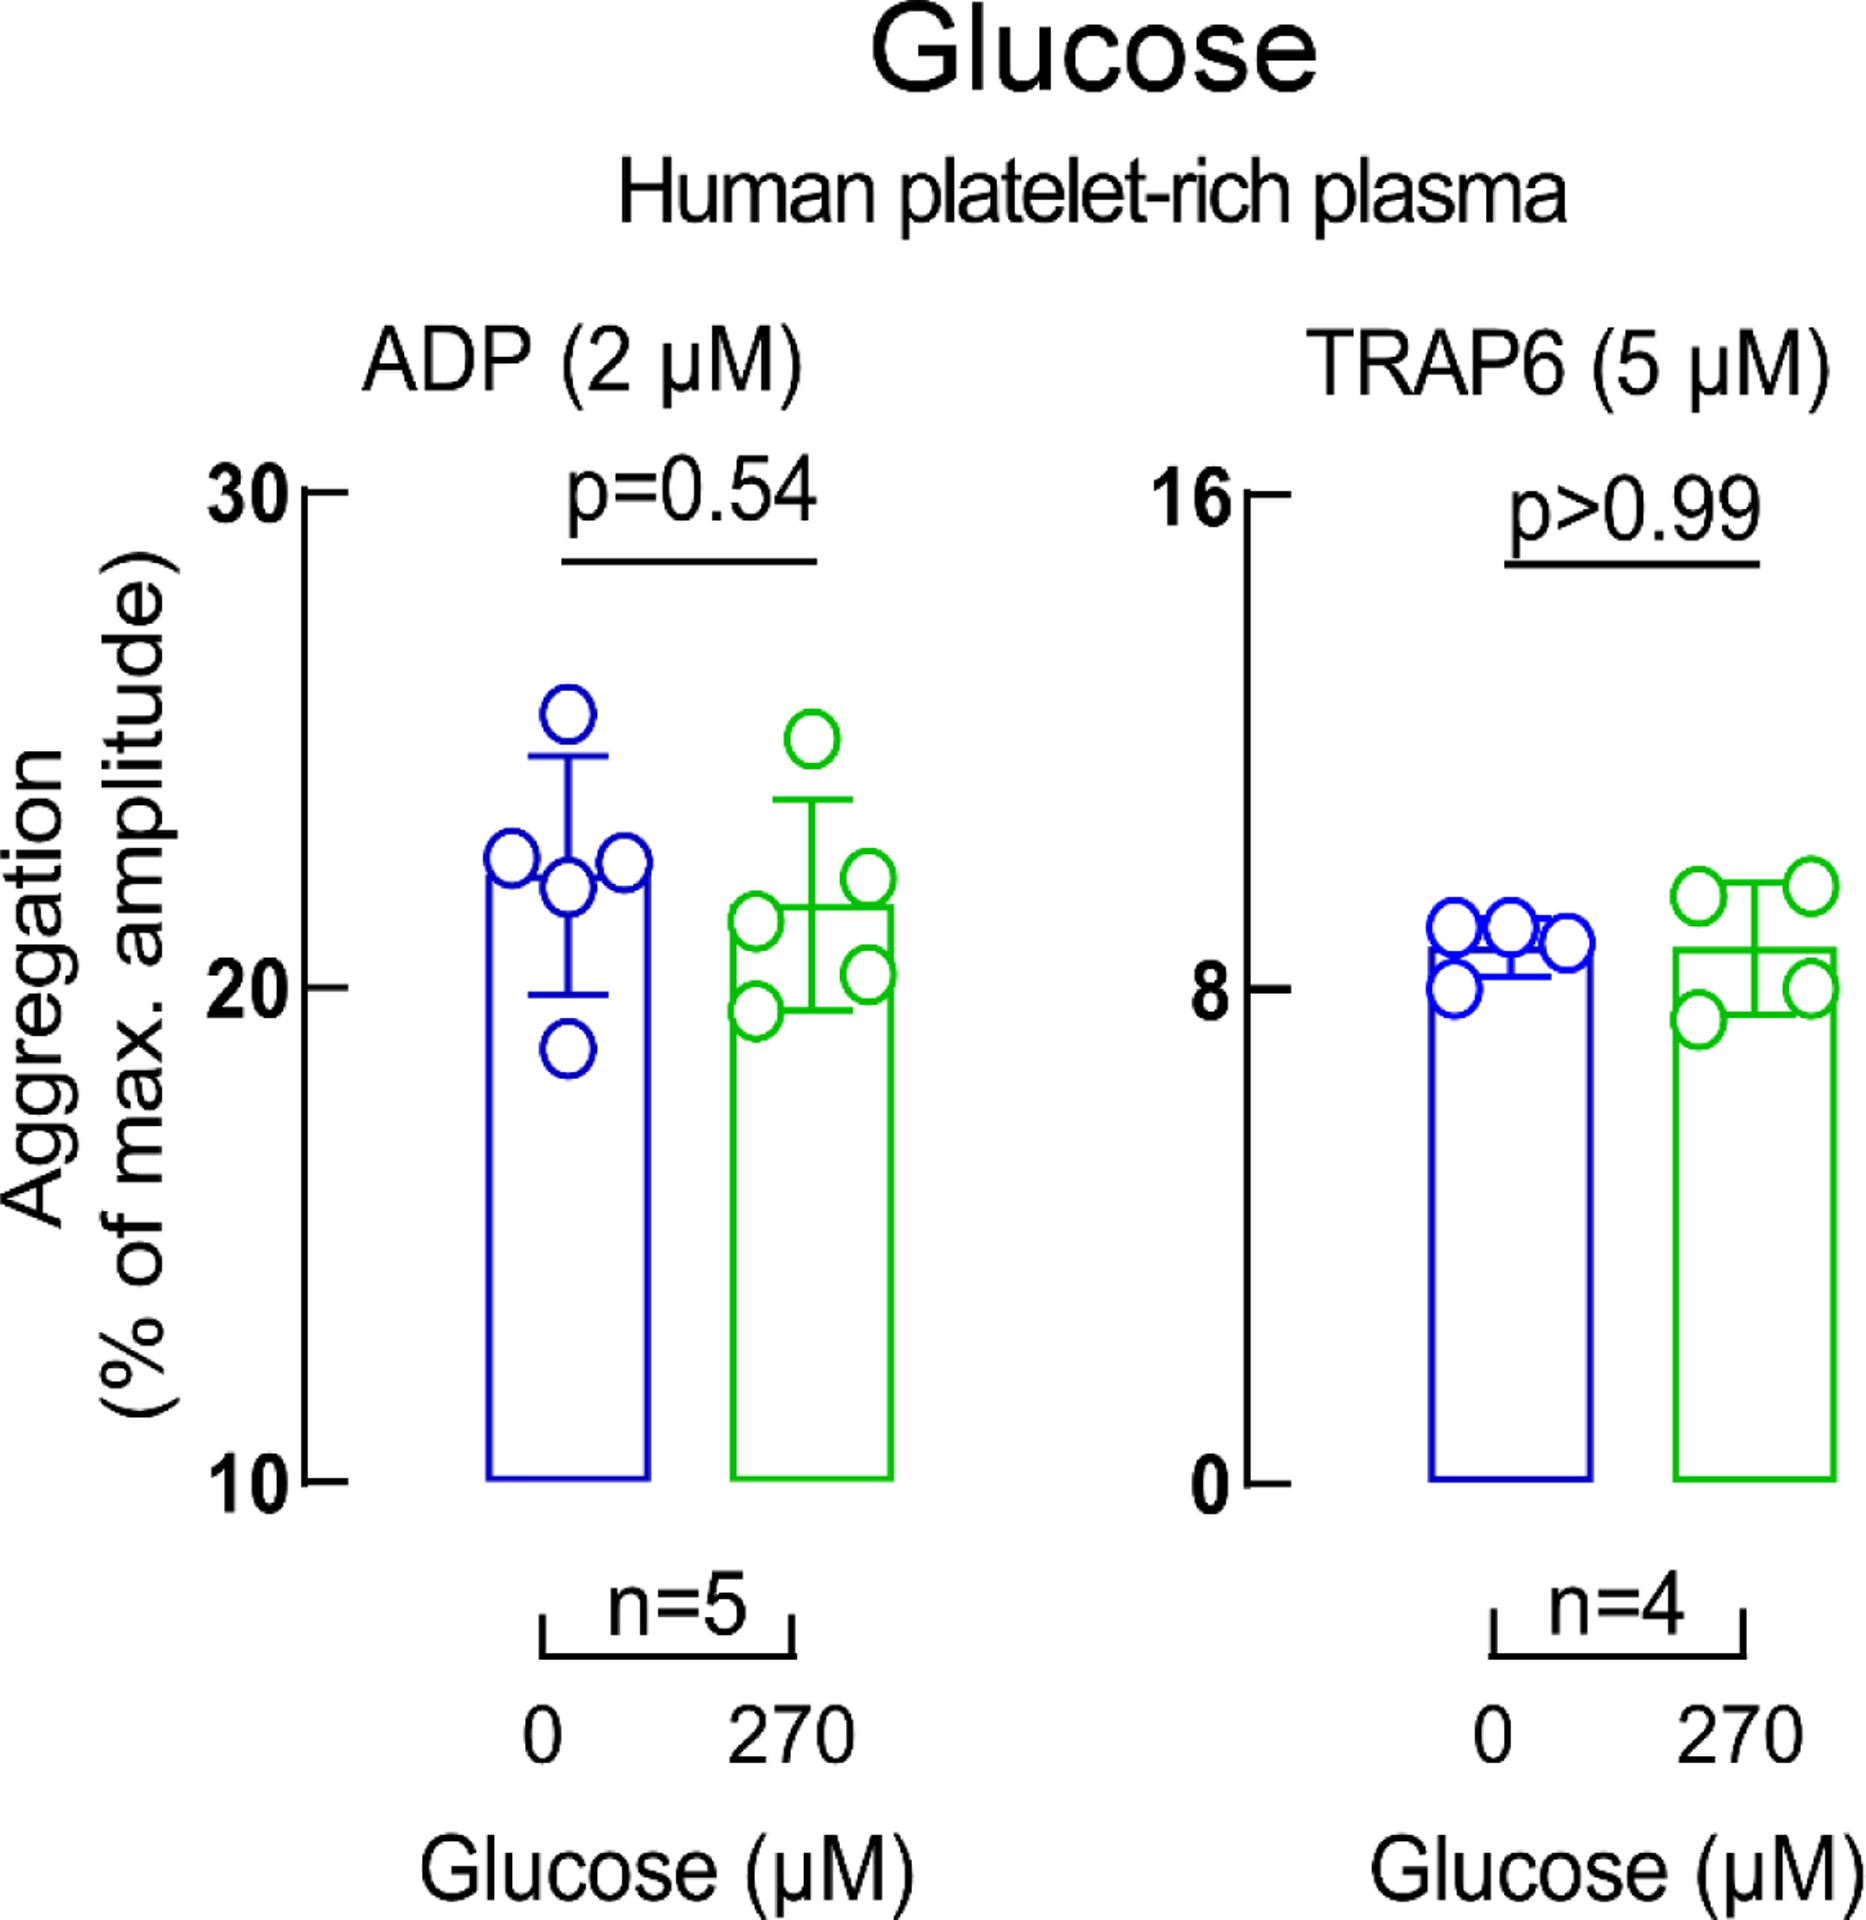
Extended Display Figure 5. Impact of glucose on platelet aggregation.

ADP-stimulated (left panel) and Thrombin receptor-activating peptide (TRAP) 6-stimulated (right panel) platelet aggregometry responses in human platelet-rich plasma incubated with glucose (270 μM, green) versus vehicle (saline, blue). Data in bar graphs are represented as means (±SD). Two-sided P values were calculated using Mann–Whitney U-test. Numbers of independent biological replicates (n) are indicated.
