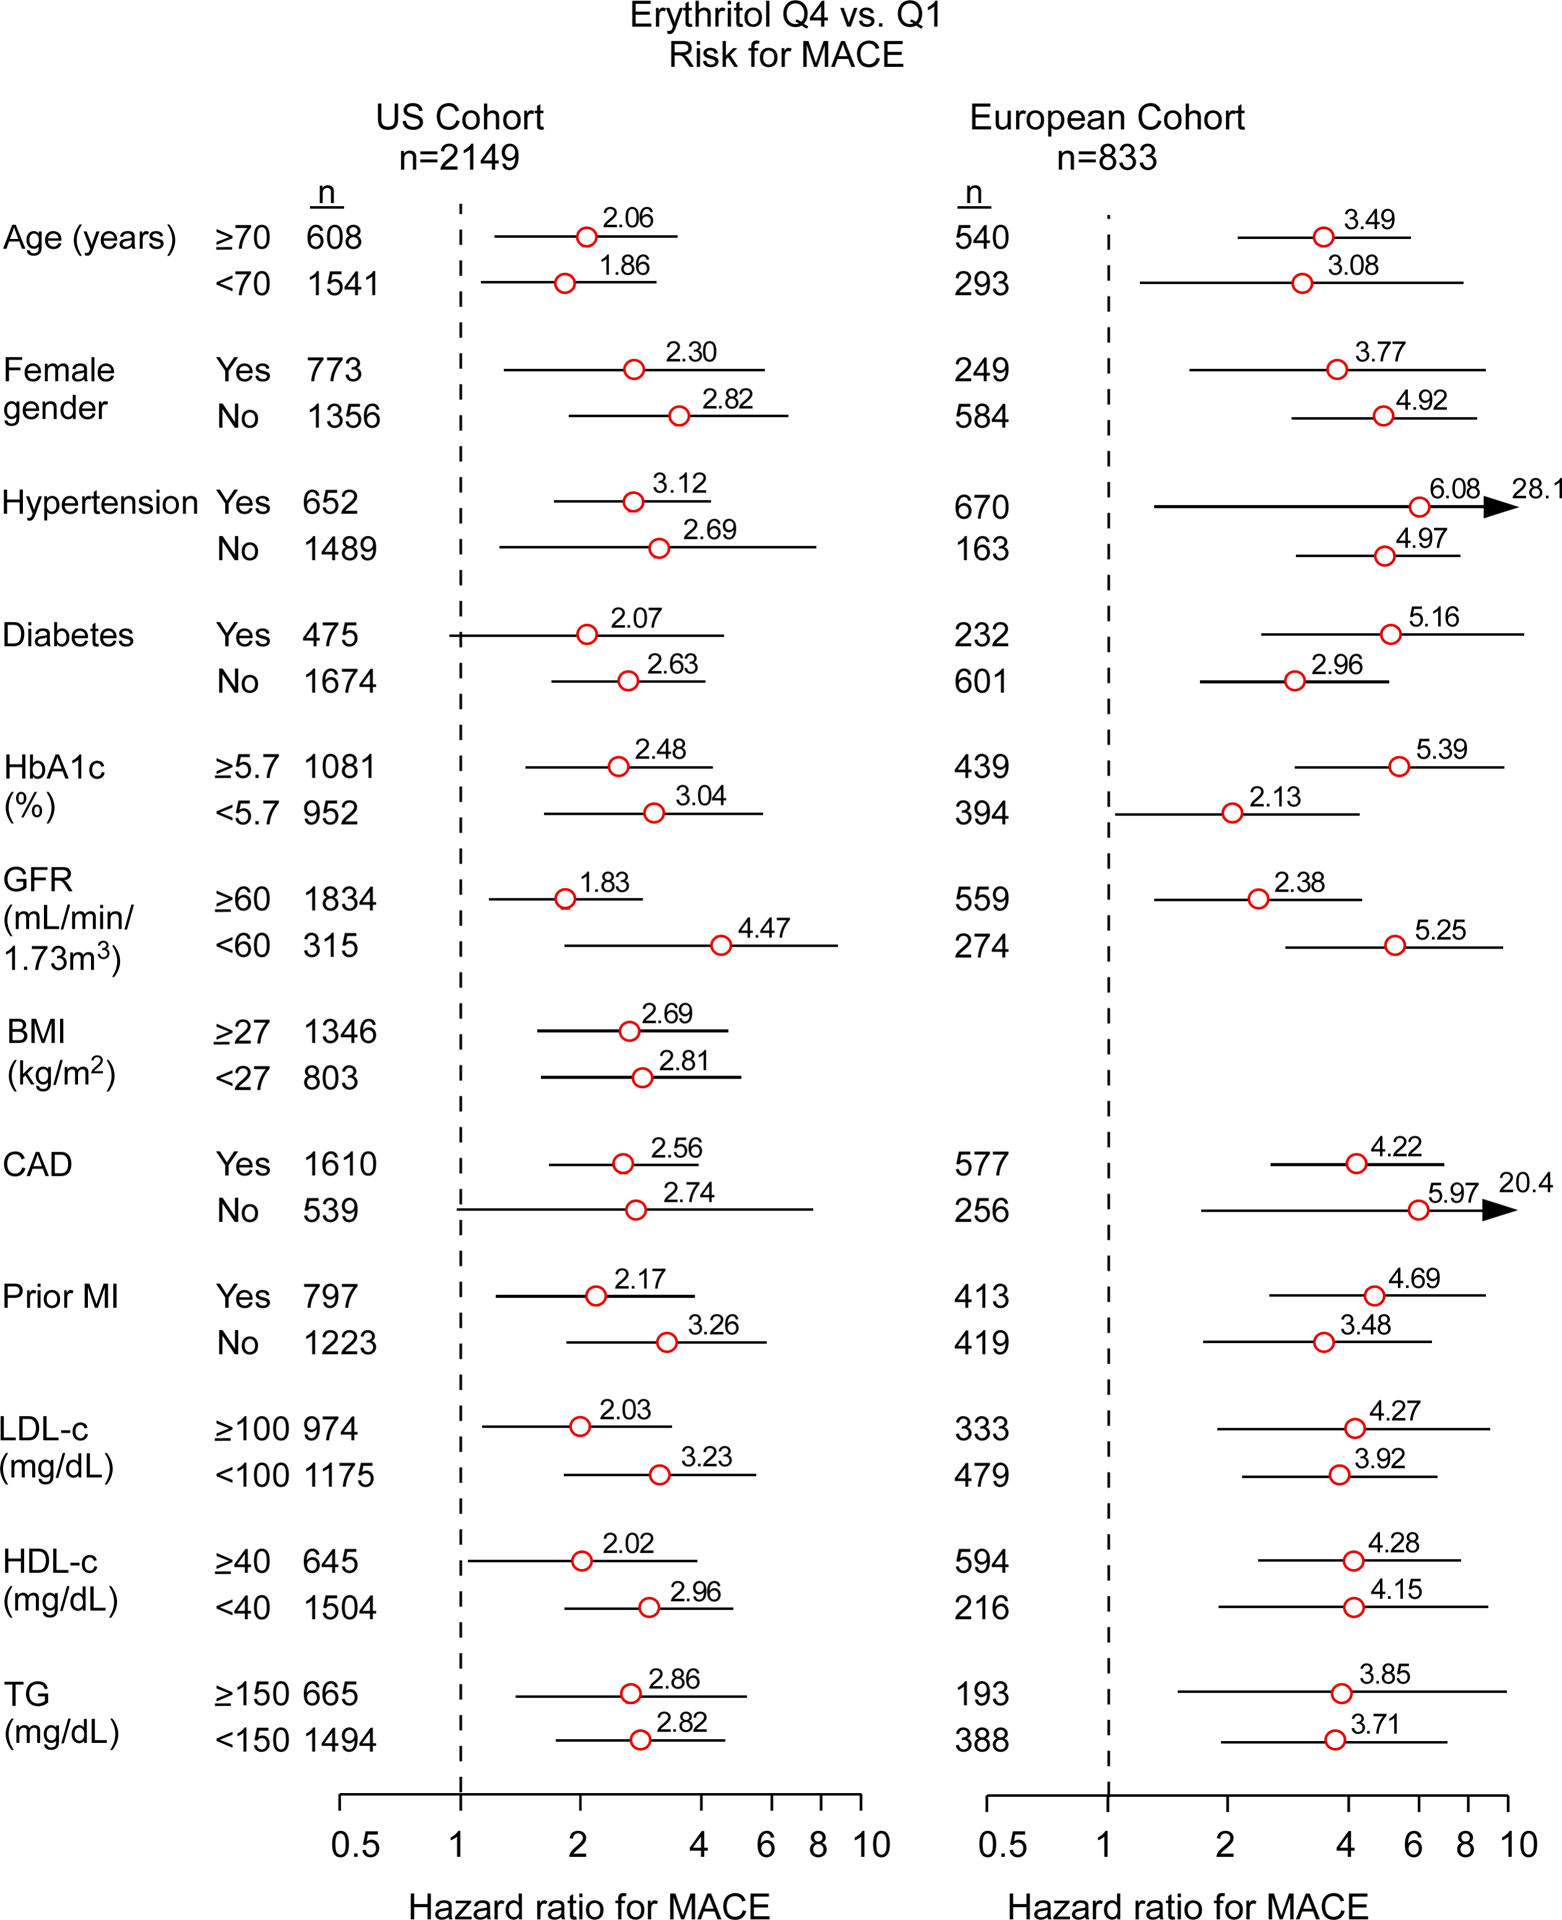
Figure 2. Long term risk of Major Adverse Cardiovascular Events (MACE) among patient subgroups.

Hazard ratios (HR) for 3 year MACE based on Cox proportional-hazards regression analysis compare top to bottom quartiles (Q) for the US cohort (left panel) and European cohort (right panel). Data points (open circles) in the centre indicate HR (with point estimates shown to the right), 95% confidence intervals are represented by line length. N numbers for each subgroup are indicated. P values for interaction with the groups and tabular data are shown in TableS10 and S11.
