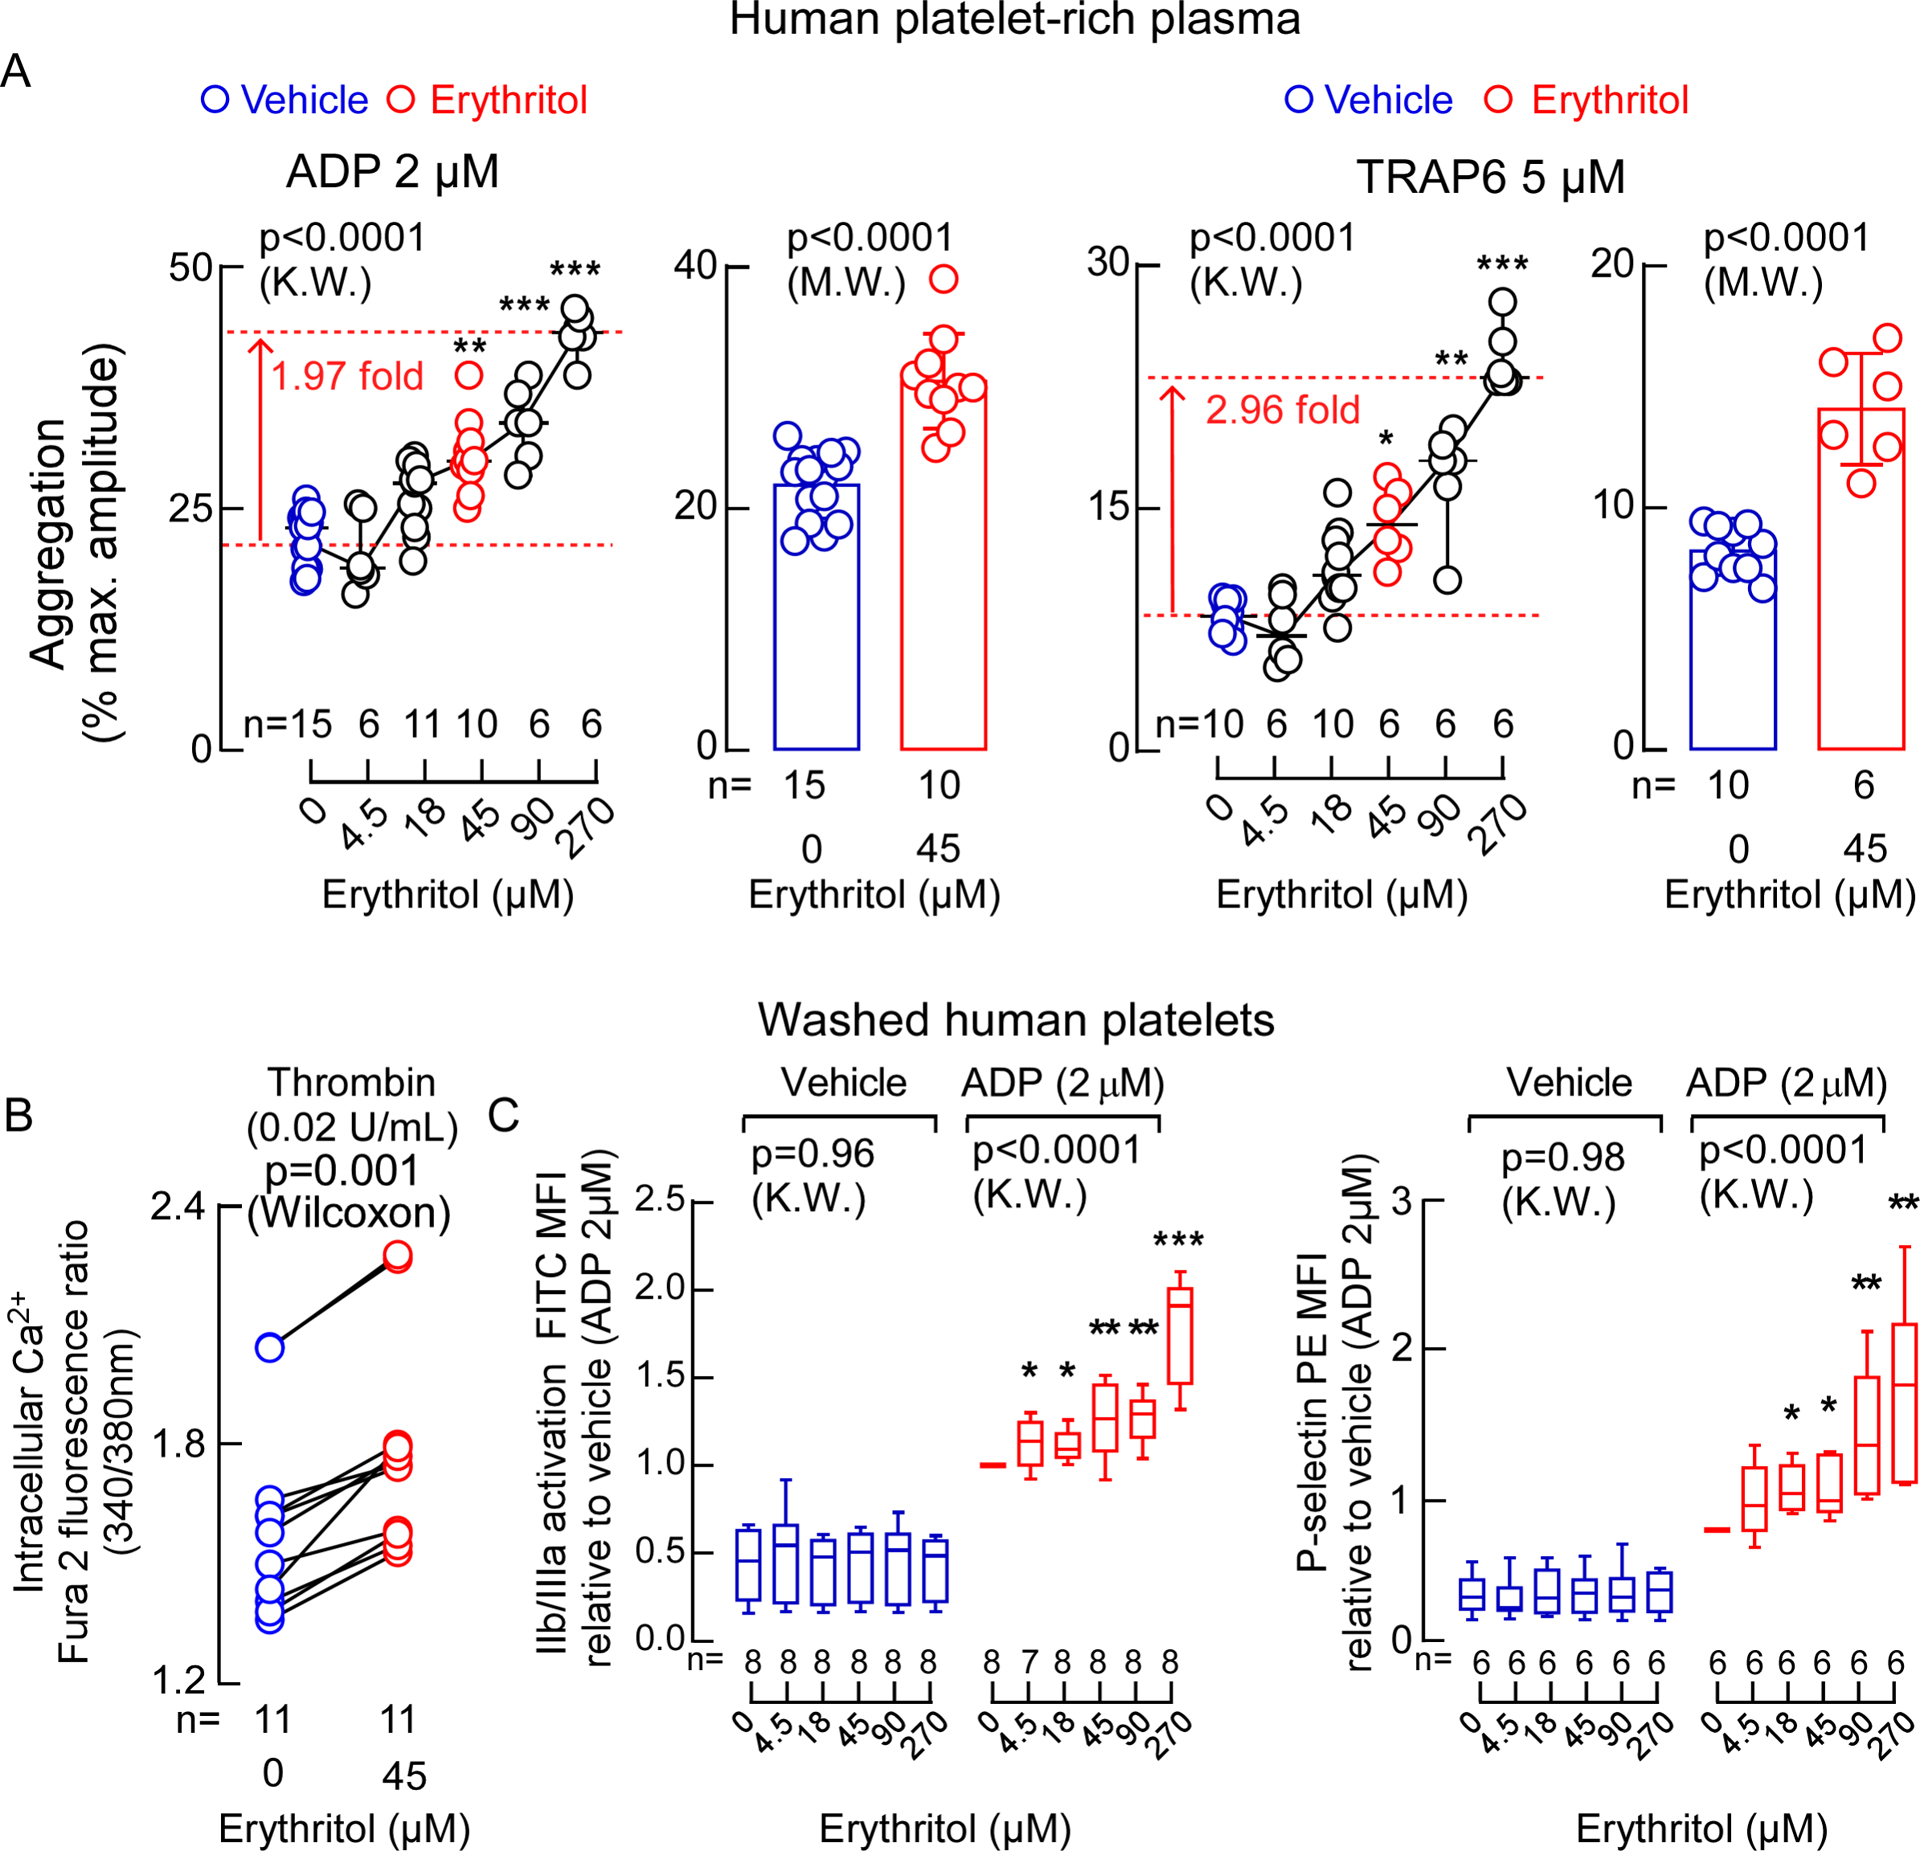
Figure 3. Erythritol enhances platelet responsiveness.

A. Bar graphs show submaximal ADP-stimulated (2 μM) and Thrombin receptor-activating peptide 6 (TRAP6)-stimulated (5 μM) platelet aggregometry responses of human platelet-rich plasma following incubation with erythritol (45 μM, red) versus normal saline (vehicle, blue). Data are represented as means (±SD), and P values were calculated by two-tailed Mann Whitney Test. Scatter plots show aggregometry with varying concentrations of erythritol and fixed submaximal level of ADP (2 μM) or TRAP6 (5 μM) including the data that is used in the bar graphs. P values were calculated by two-sided Kruskal Wallis test with Dunn’s post hoc test. For ADP-stimulated PRP, n=15 for vehicle, n=6 for Erythritol 4.5 μM, n=11 for Erythritol 18 μM, n=10 for Erythritol 45 μM, n=6 for Erythritol 90 and 270 μM. For TRAP6-stimulated PRP, n=10 for vehicle, n= 6 for Erythritol 4.5 μM, n=10 for Erythritol 18 μM, n=6 for Erythritol 45, 90 and 270 μM. (*p < 0.05; **p < 0.01; ***p < 0.001). Dunn’s adjusted P values for ADP-stimulated PRP (Erythritol vs. vehicle): Erythritol 45 μM P=0.002, Erythritol 90 μM P=0.0008, Erythritol 270 μM P<0.0001. Dunn’s adjusted P values for TRAP6-stimulated PRP (Erythritol vs. vehicle): Erythritol 45 μM P=0.02, Erythritol 90 μM P=0.002, Erythritol 270 μM P<0.0001. B. Thrombin-induced (0.02 U) changes in intracellular calcium concentration [Ca2+] in Fura 2-filled washed human platelets incubated with erythritol. P values were calculated by two-sided Wilcoxon matched-pairs signed rank test. n=11 per group. C. ADP-induced changes in GP IIb/IIIa (PAC-1 antibody staining) and P-selectin surface expression in washed human platelets pre-incubated with the indicated concentrations of erythritol. Boxes show 25th and 75th percentiles. The line in the box (centre) is the median, whiskers represent minimum and maximum values. P values were calculated by two-sided Kruskal Wallis test with Dunn’s post hoc test for all samples. For GP IIb/IIIa activation, n=7 for ADP-stimulated PRP exposed to erythritol 4.5 μM, for all other conditions n=8 per group. For P-selectin surface expression n=8 per group. (*p < 0.05; **p < 0.01; ***p < 0.001). Dunn’s adjusted P values for GP IIb/IIIa activation (Erythritol vs. vehicle): Erythritol 4.5 μM P=0.04, Erythritol 18 μM P=0.02, Erythritol 45 μM P=0.003, Erythritol 90 μM P=0.002, Erythritol 270 μM P<0.0001. Dunn’s adjusted P values for P-selectin surface expression (Erythritol vs. vehicle): Erythritol 18 μM P=0.03, Erythritol 45 μM P=0.04, Erythritol 90 μM P=0.005, Erythritol 270 μM P=0.001. Each data point represents an individual measurement or the average of multiple measurments of a distinct sample. There were no repeated measurements within the data shown.
