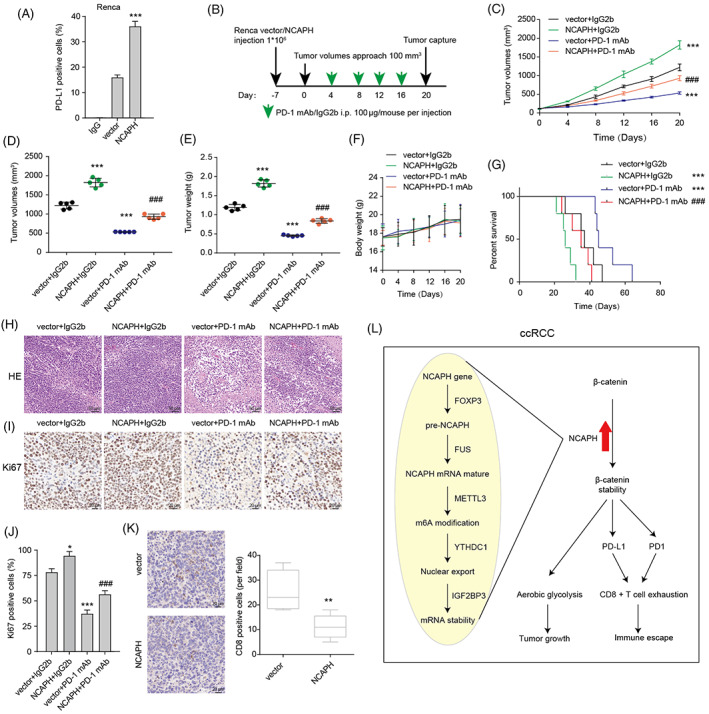
FIGURE 7.

Non‐SMC condensin I complex subunit H (NCAPH) is related to the resistance to anti‐PD‐1 therapy in clear cell renal cell carcinoma (ccRCC). (A) Membrane PD‐1 expression in Renca cells with mouse NCAPH overexpression was measured by flow cytometry. (B) Schematic diagram showing the grouping and treatment plan of the in vivo study: C57BL/6 mice were inoculated with 106 control or mouse NCAPH overexpressed Renca cells and received PD‐1 mAb treatment or IgG2b control at the indicated time points (five mice per group). (C) Tumour growth curves of the xenograft. (D and E) The volumes and weight of captured xenograft. (F) Body weight of mouse in the process of the treatment. (G) Survival curves of mouse with indicated treatment. (H and I) HE and Ki67 staining of xenograft. (J) The Ki67‐positive cells in the slice were counted. *p < 0.05; ***p < 0.001 versus vector + IgG2b; ### p < 0.001 versus vector + PD‐1 mAb. (K) The infiltrated CD8 T cells were counted through CD8 IHC. **p < 0.01. (L) Working model for NCAPH/β‐catenin axis in ccRCC. Three independent experiments were performed.
