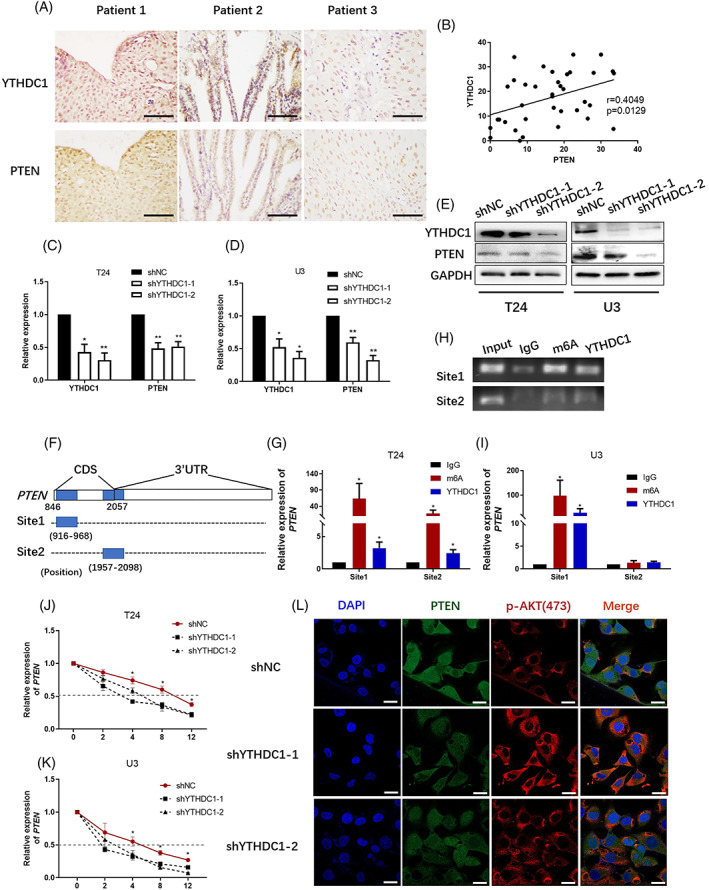
FIGURE 1.

YTHDC1 positively regulates PTEN expression in bladder cancer. YTHDC1 and PTEN level were detected by an immunohistochemistry assay in tumour sections from 37 bladder cancer patients. The correlation between YTHDC1 and PTEN levels was analysed with Graphpad Prism 8.0 software. (A) Representative images show YTHDC1 and PTEN expression in three identical patients. The scale bar indicates 50 μm. (B) A scatter plot shows the correlation between YTHDC1 and PTEN levels. The expression of YTHDC1 and PTEN levels were analysed by (C and D) quantitative real‐time polymerase chain reaction (PCR) and (E) Western blot. Data are presented as the mean ± SEM, and experiments were performed at least three times. GAPDH was applied as an internal control. (F) Modification of m6A on PTEN mRNA was predicted by using SRAMP database (www.cuilab.cn/sramp). Schema illustrates the predicted mode. (G–I) The binding potential between YTHDC1 and PTEN mRNA was evaluated by using a RIP assay. IgG was taken as a negative control. (H) Representative images show pulldown products in T24 bladder cancer cells by performing agarose gel electrophoresis. Data are presented as the mean ± SEM, and experiments were performed at least three times. (J and K) The cells were treated with 5 μg/ml actinomycin D, and the expression of PTEN was detected by quantitative real‐time PCR. Data are presented as the mean ± SEM, and experiments were performed at least three times. (L) The expression of PTEN and p‐AKT(ser473) were evaluated via performing an immunofluorescence assay. T24 bladder cancer cells were captured microscopically and the scale bar indicates 50 μm. Experiments were performed at least three times.
