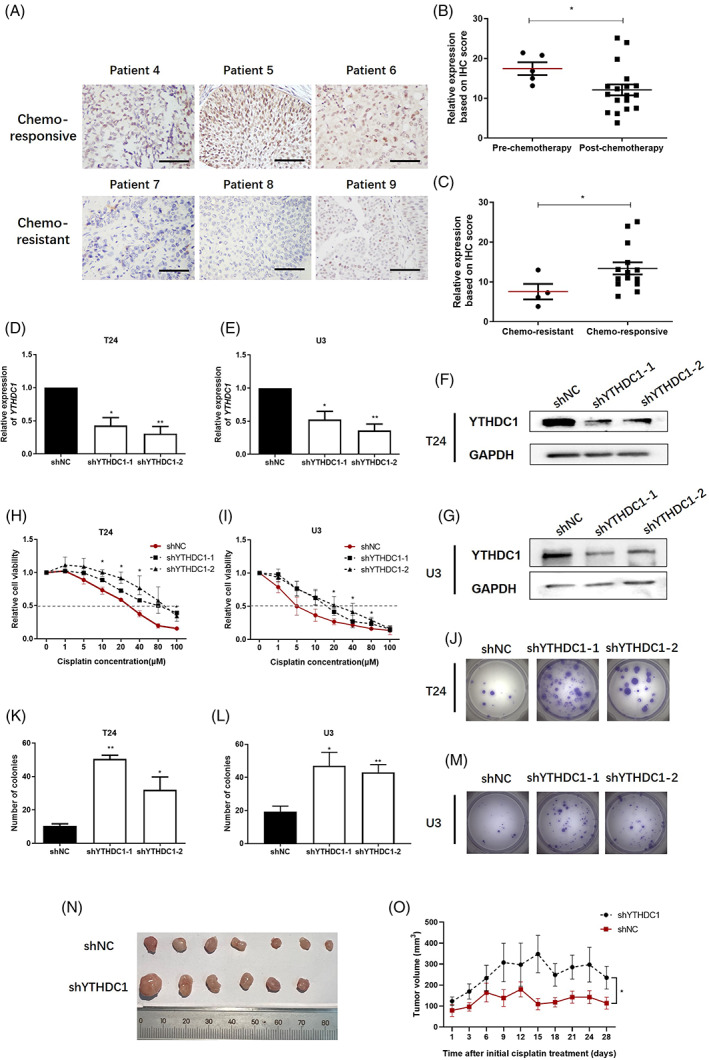
FIGURE 2.

Lower YTHDC1 level indicates poor cisplatin response in bladder cancer. YTHDC1 level was detected by immunohistochemistry (IHC) assay in tumour sections from 20 bladder cancer patients that have received cisplatin‐containing chemotherapy. (A) Representative images show YTHDC1 expression in six identical patients. (B and C) Scatter plots show IHC scores for YTHDC1 staining. The scale bar indicates 50 μm. (D and E) Real‐time polymerase chain reaction (PCR) evaluated the expression of YTHDC1 on mRNA level. (F and G) The protein level of YTHDC1 was detected by Western blot. GAPDH was applied as an internal control both for quantitative real‐time PCR and Western blot detection. Data are presented as the mean ± SEM, and experiments were performed at least three times. (H and I) After 48 h of treatment with different doses of cisplatin, cell viabilities were measured by using Cell Counting Kit‐8 assay. Data are presented as the mean ± SEM, and experiments were performed at least three times. (J–M) After treatment with 20 μM cisplatin, the growth of single cells was measured after 2 weeks by a colony formation assay. Representative images are displayed. (K and L) Colonies with over 50 cells were counted. Data are presented as the mean ± SEM, experiments were performed at least three times. Mice that bearing bladder carcinoma xenograft were treated with cisplatin (3 mg/kg) per week. The response to cisplatin treatment was reflected by the change of tumour size. (N) Representative images illustrate dissected tumour samples at the end of experiment. (O) The size of tumour xenografts was measured every 3 days and tumour growth curve was displayed. shYTHDC1‐2 cells were selected and used to construct YTHDC1 silencing xenografts. Data are presented as the mean ± SEM.
