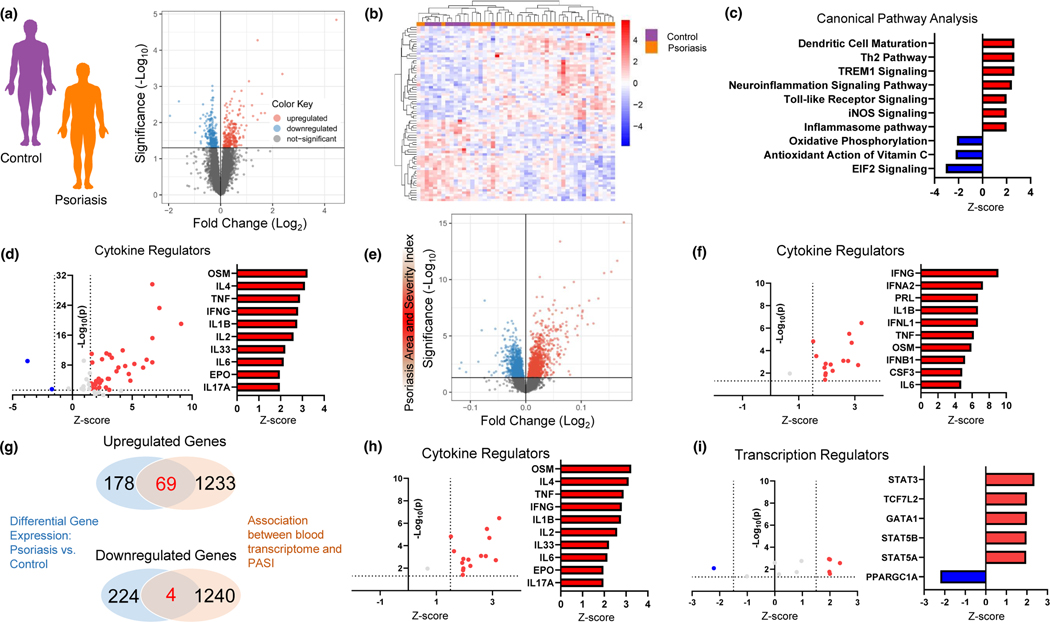
Figure 1: A circulating transcriptomic signature in psoriasis centers around pro-inflammatory processes.
A) Study design and volcano plot (nominal p<0.05), B) Heat map of top differentially expressed genes (nominal p<0.01), C) Top differentially expressed canonical pathways, and D) Enriched cytokine regulators of whole blood gene expression comparing psoriasis (n=37) to controls (N=11). E) Study design and volcano plot (nominal p<0.05) and F) Enriched cytokine regulators of differentially expressed blood transcripts assessing the association between psoriasis area and severity index and whole blood gene expression (nominal p<0.05). G) Overlap in upregulated and downregulated gene expression (genes = 73) between psoriasis vs. control (A) and association between psoriasis severity and whole blood gene expression (E). Enriched cytokine H) and transcript regulators I) of gene overlap from G. All pathways assessed using Ingenuity Pathway Analysis with differential gene expression adjusted for age, gender, body mass index, and active biologic use.

