. 2023 Jun 8;5(14):3619–3628. doi: 10.1039/d3na00112a

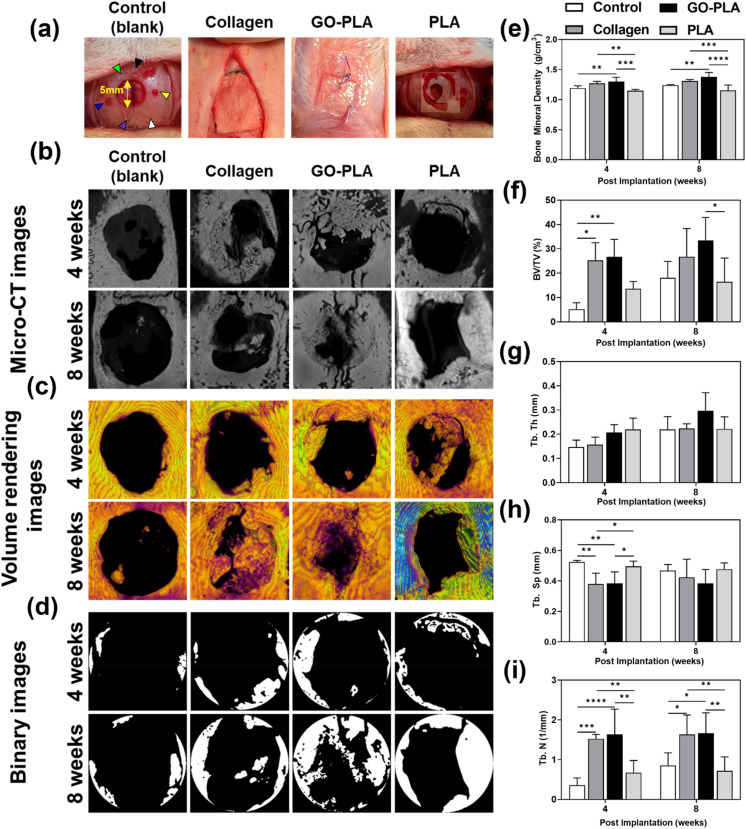
Fig. 4. Images and statistical results of the calvarial defect model with/without films using micro-CT analysis. (a) Digital images of film implantation on calvarial bone defect models. Each arrowhead indicates as follows, green: coronal suture, black: bregma, blue: left lateral parietal bone, purple: lambda, yellow: right lateral parietal bone, and white: lambdoid suture. (b) Micro-CT images, (c) volume rendering images, and (d) binary images according to micro-CT analysis. Bone healing on the films were statistically evaluated for (e) BMD, (f) BV/TV, (g) Tb.Th, (h) Tb.Sp, and (i) Tb.N. The asterisks represent statistical differences (*p < 0.05, **p < 0.01, ***p < 0.001, and ****p < 0.0001).

Fig. 4