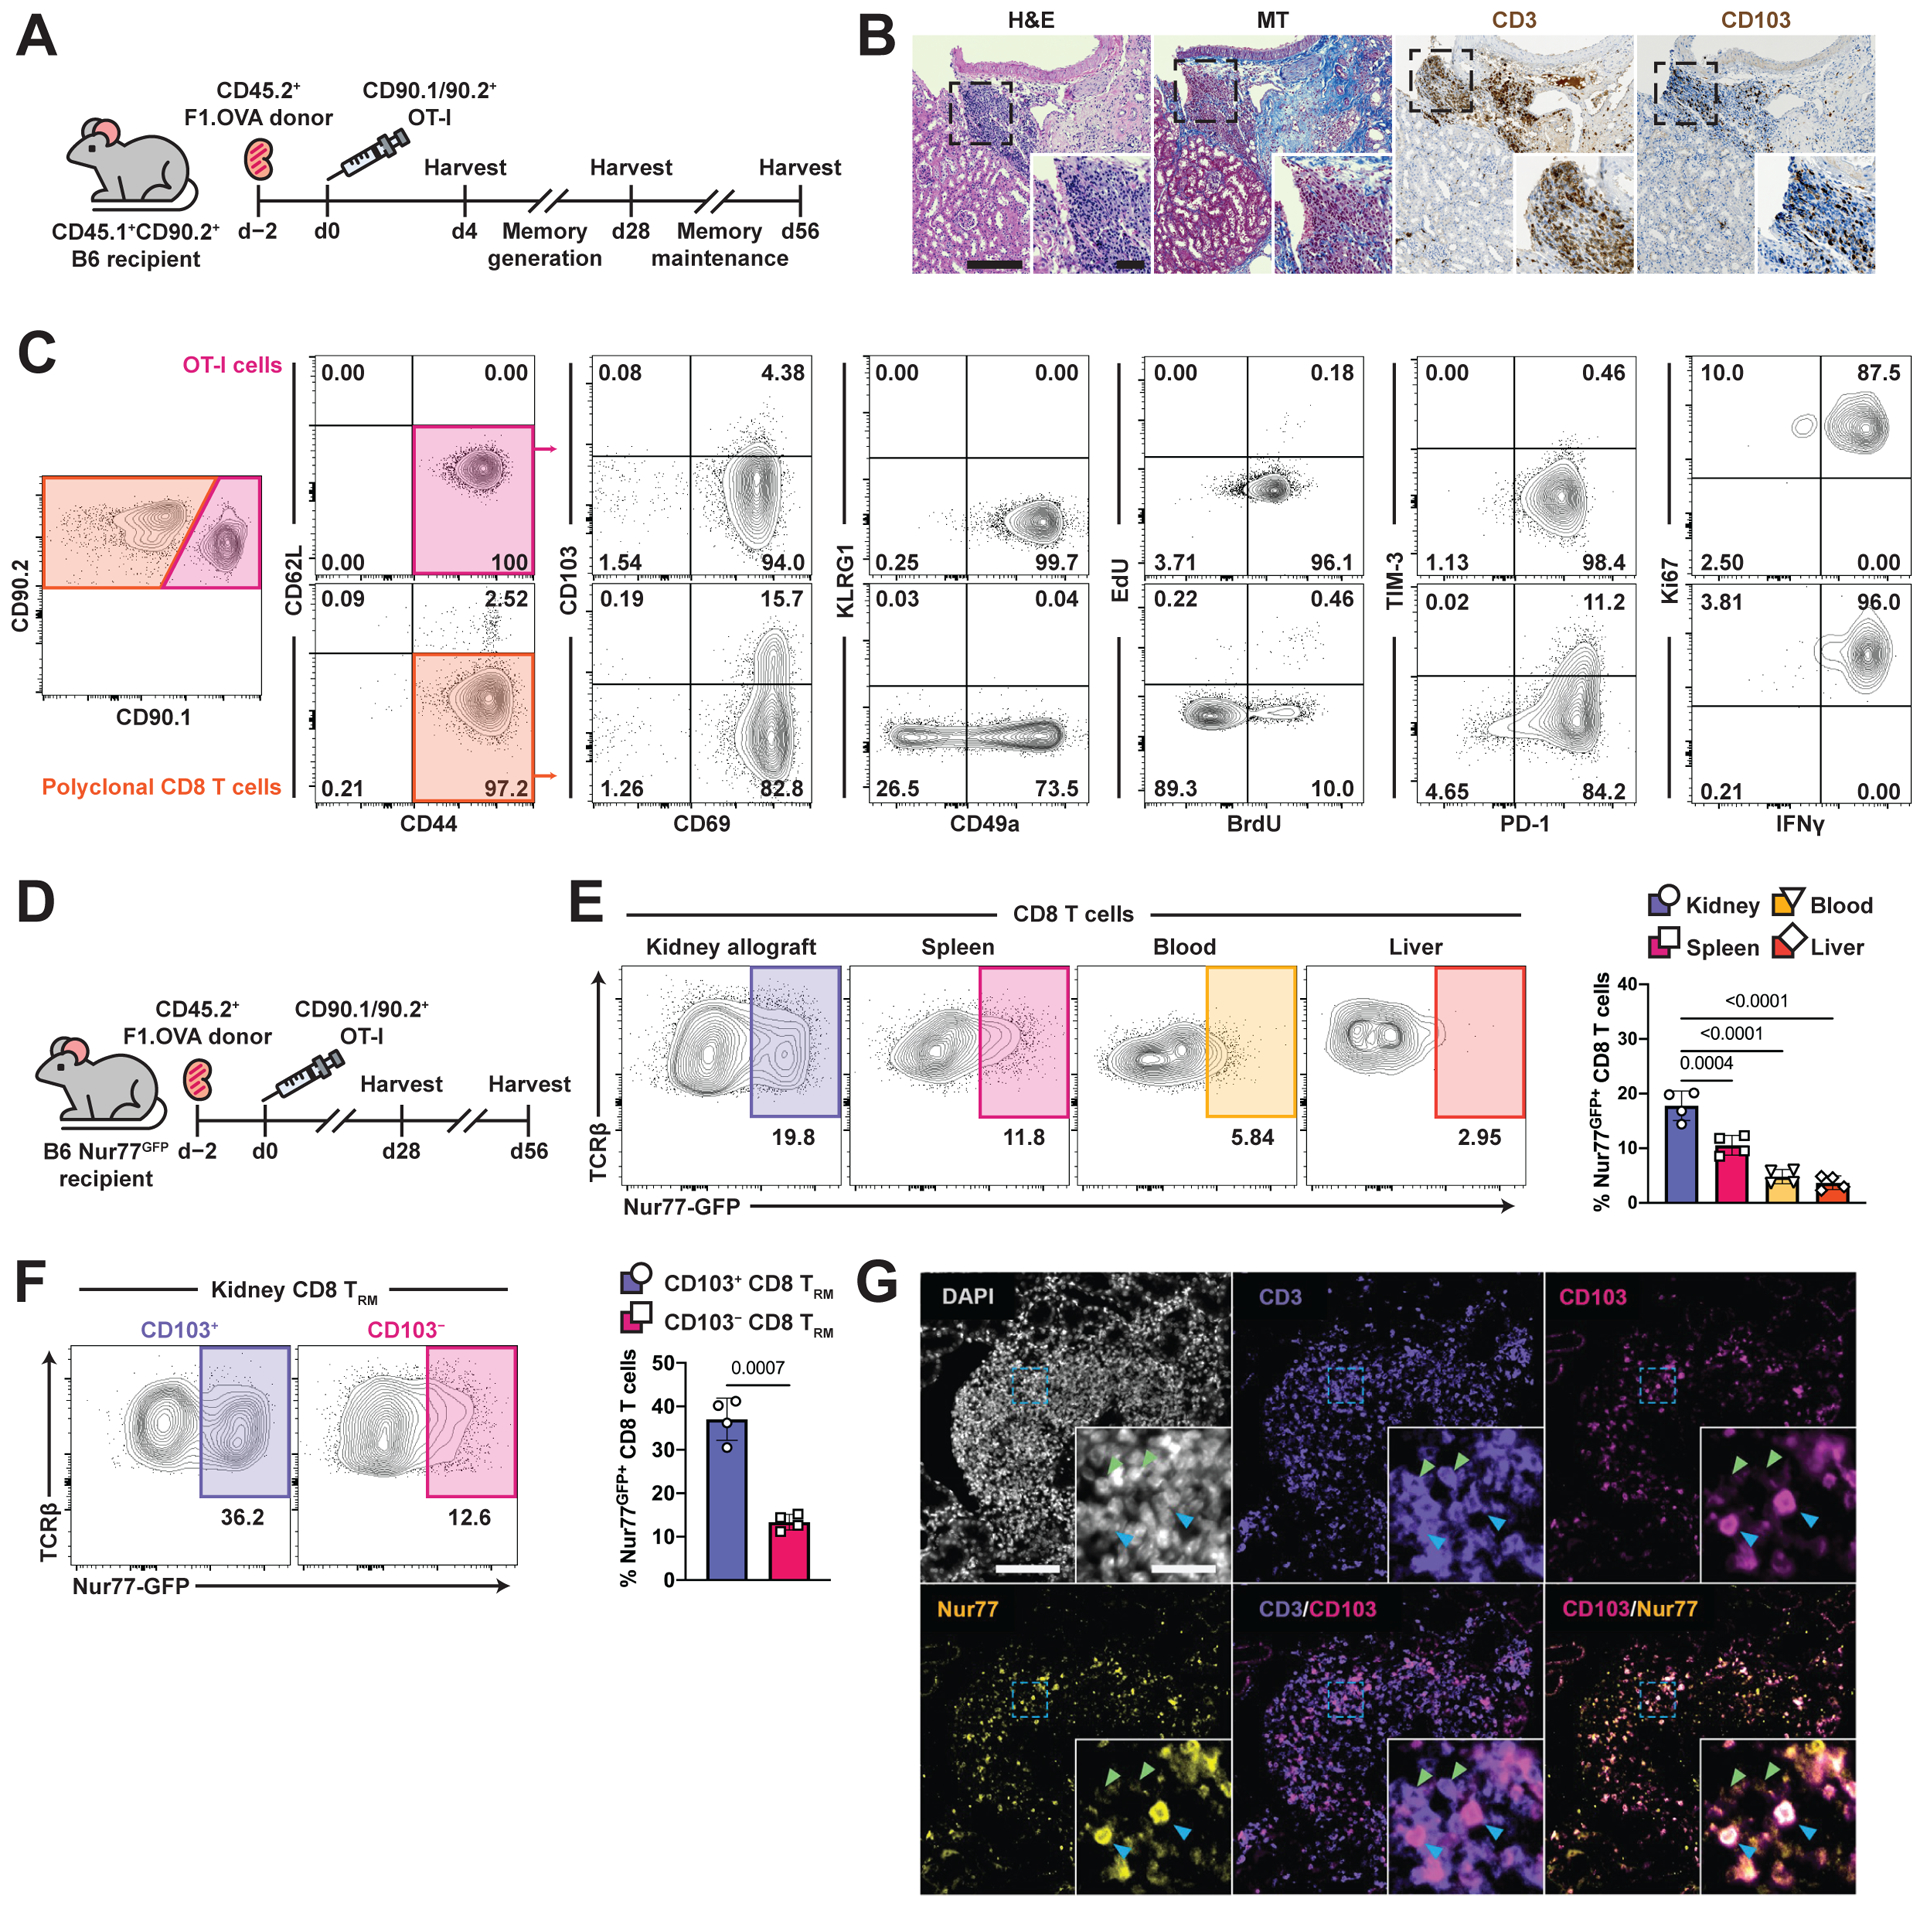
Fig.1. TRM cells form in renal allografts and encounter local cognate antigen.

(A) (Balb/c × B6.OVA) F1 (F1.OVA) kidney allografts were transplanted into B6 recipients followed by adoptive transfer of 1 × 10⁶ effector OT-I cells 2 days post-transplantation. Transplant recipients were harvested at indicated times.
(B) H&E, Masson’s trichrome (MT), and anti-CD3 and anti-CD103 stained sections of renal allograft tissue 56 days post-transplantation. Insets highlight areas of T cell infiltration. Blue in MT staining indicates fibrosis. Whole image scale bar: 200 μm. Inset scale bar: 50 μm. n = 6 mice.
(C) Transferred CD90.1/90.2+ OT-I and recipient-derived polyclonal CD90.2+ CD8 T cells from 28-day post-transplant kidney allografts were analyzed for TRM markers after gating on extravascular graft CD8+ T cells as shown in Fig. S1B. BrdU water was administered 7 days before and EdU injected 1 hour prior to harvest. n = 8 mice.
(D) F1.OVA kidney allografts were transplanted into Nur77-GFP B6 recipients followed by adoptive transfer of 1 × 10⁶ effector OT-I cells 2 days post-transplantation. Transplant recipients were harvested on days 28 and 56. n = 4 mice per time point.
(E) Representative plots (left) and percentage (graph, right) of Nur77-GFP expression by CD8 T cells in various tissues on day 56.
(F) Representative plots (left) and percentage (graph, right) of Nur77-GFP expression based on CD103 expression.
(G) Immunofluorescence staining of renal allograft tissue on day 56 for DAPI (white), CD3 (purple), CD103 (magenta), and Nur77 (yellow). Blue arrows point to cells co-expressing CD3, CD103 and Nur77. Green arrows point to cells expressing only CD3. Whole image scale bar: 100 μm. Inset scale bar: 20 μm. n = 5 mice.
P values were determined by (E, F) two-tailed unpaired t test.
