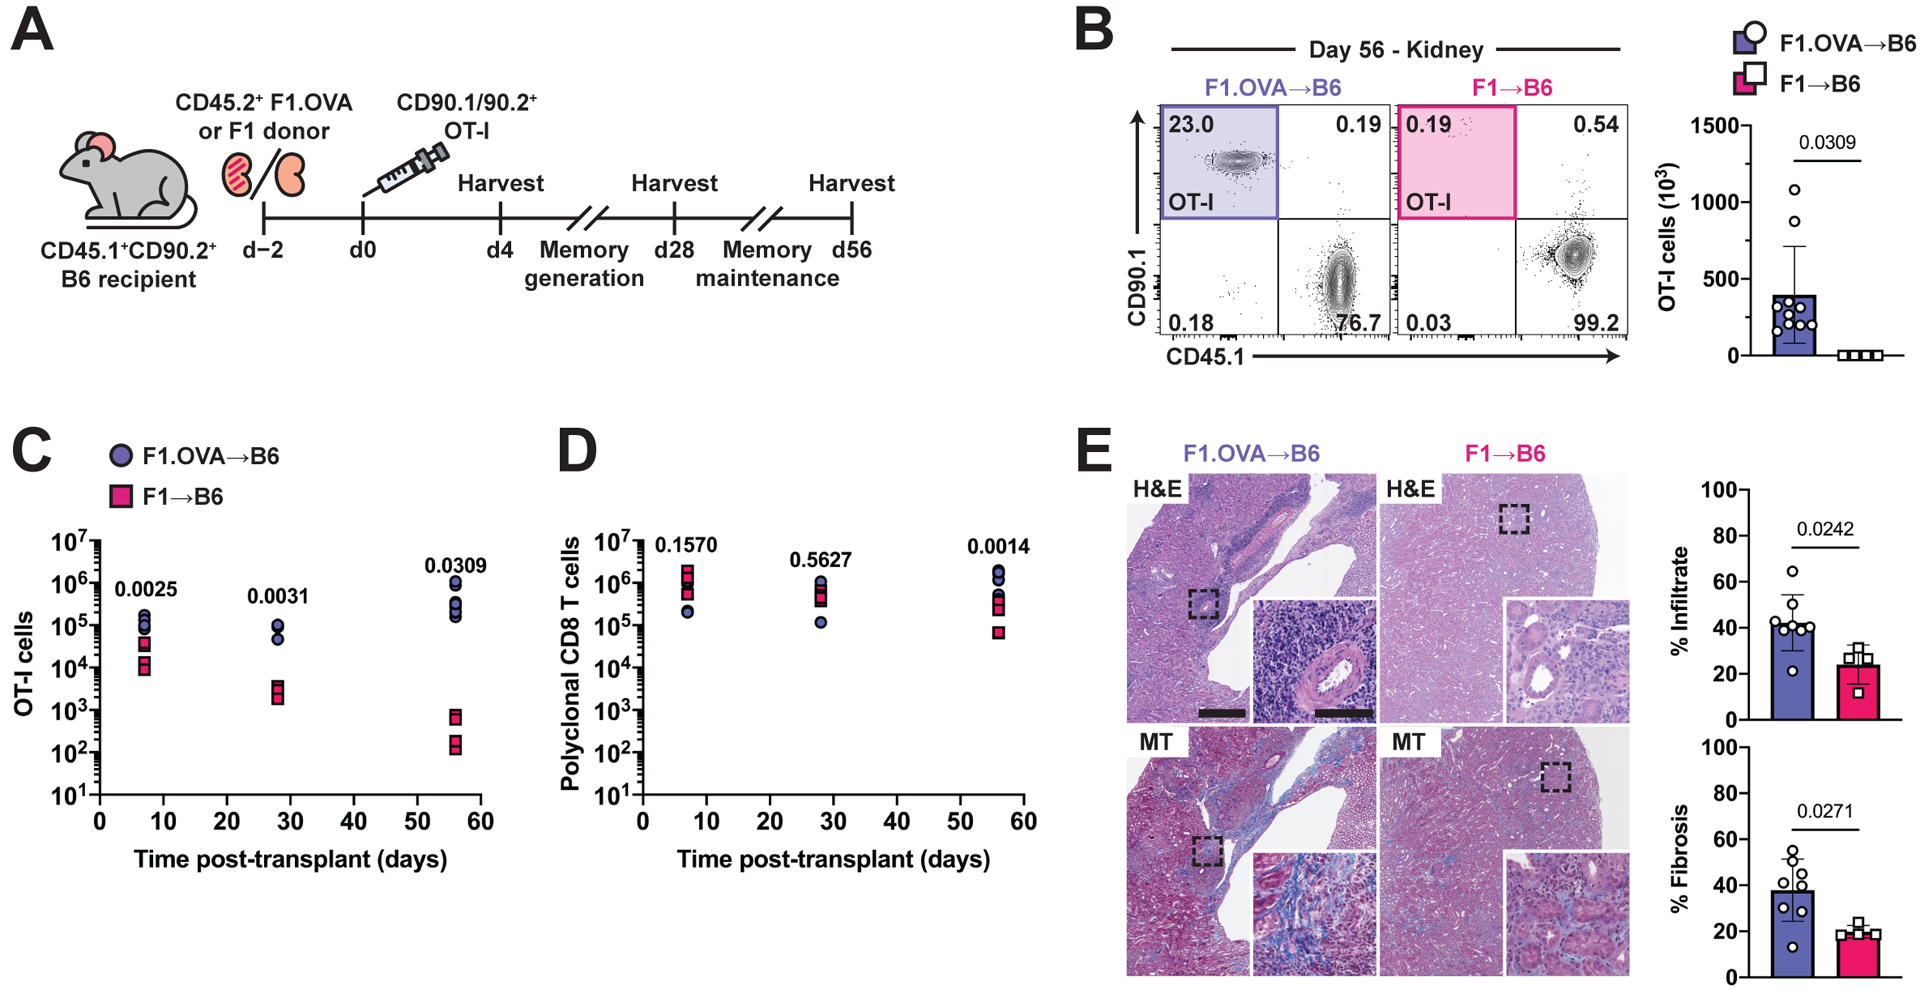
Fig. 2. Reduced number of intragraft TRM cells in the absence of cognate antigen.

(A) F1.OVA or (Balb/c × B6) F1 kidney allografts were transplanted into B6 recipients followed by adoptive transfer of 1 × 10⁶ effector OT-I cells 2 days post-transplantation. Transplant recipients were harvested on day 4 to study effector CD8 T cell graft infiltration, and on days 28 and 56 to study maintenance of CD8 TRM cells. Flow analysis was performed after gating on extravascular graft CD8+ T cells as shown in Fig. S1B. n = 4–8 mice per group.
(B) Percentage (representative plots, left) and absolute number (graphs, right) of CD90.1+ OT-I cells on day 56.
(C, D) Enumeration of CD90.1+ OT-I cells (C) and polyclonal CD45.1+CD90.1− CD8 T cells (D) in renal allograft tissue on days 4, 28, and 56. n = 4–8 mice per group per time point.
(E) H&E and Masson’s trichrome-stained sections of F1.OVA renal allograft tissue (representative images, left) and quantification of infiltrate and fibrosis (graphs, right) day 56. Whole image scale bar: 500 μm. Inset scale bar: 100 μm.
P values were determined by (B-E) two-tailed unpaired t test.
