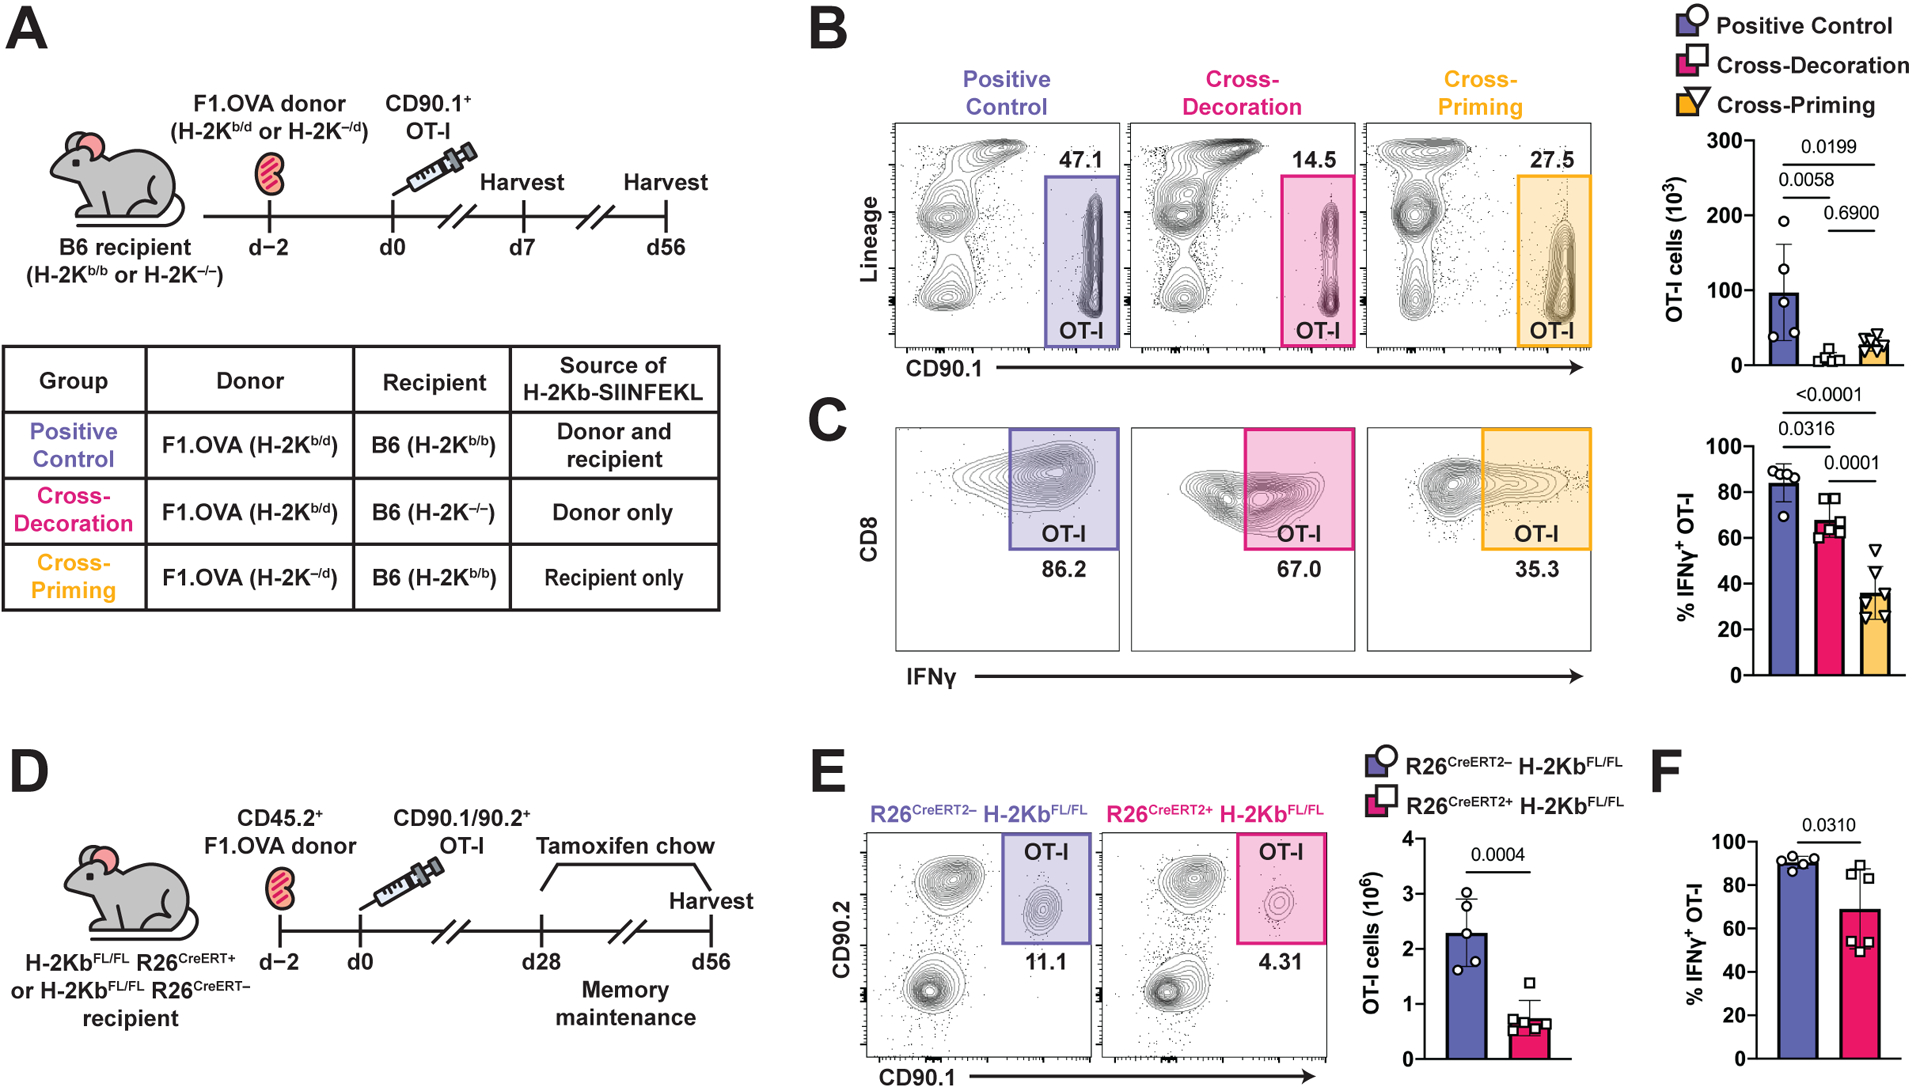
Fig. 4. MHC-I presentation of cognate antigen via cross-priming and cross-decoration are required for TRM cell maintenance.

(A) F1.OVA H-2Kb-sufficient (H-2Kb/d) or F1.OVA H-2Kb-deficient (H-2K–/d) kidney allografts were transplanted into B6 H-2Kb-sufficient (H-2Kb/b) or B6 H-2Kb-deficient (H-2Kb–/–) recipients followed by co-adoptive transfer of 1 × 10⁶ effector OT-I cells 2 days post-transplantation. Transplant recipients were harvested on days 7 and 56 to study maintenance of CD8 TRM cells. Flow analysis was performed after gating on extravascular graft CD8+ T cells as shown in Fig. S1B. n = 5–6 mice per group.
(B) Representative flow plots and absolute number (graph) of OT-I cells from positive control mice (intact cross-priming and cross-decoration), cross-decoration only mice (deficient cross-priming), and cross-priming only mice (deficient cross-decoration) on day 56.
(C) Representative flow plots and frequency (graph) of IFNγ+ OT-I cells from positive control mice, cross-decoration only mice, and cross-priming only mice on day 56.
(D) F1.OVA kidney allografts were transplanted into either H-2KbFL/FL R26CreERT2– or H-2KbFL/FL R26CreERT2+ B6 recipients followed by adoptive transfer of 1 × 10⁶ effector OT-I cells 2 days post-transplantation. Tamoxifen chow was introduced from days 28–56, then recipients were subsequently harvested. n = 5–6 mice per group.
(E) Representative flow plots (left) and absolute number (graph) of TRM OT-I cells after tamoxifen treatment at 56 days post-transplantation.
(F) Frequency of IFNγ+ OT-I cells after restimulation with F1.OVA donor splenocytes.
P values were determined by (B, C) one-way ANOVA with Tukey’s correction, and (E, F) two-tailed unpaired t test.
