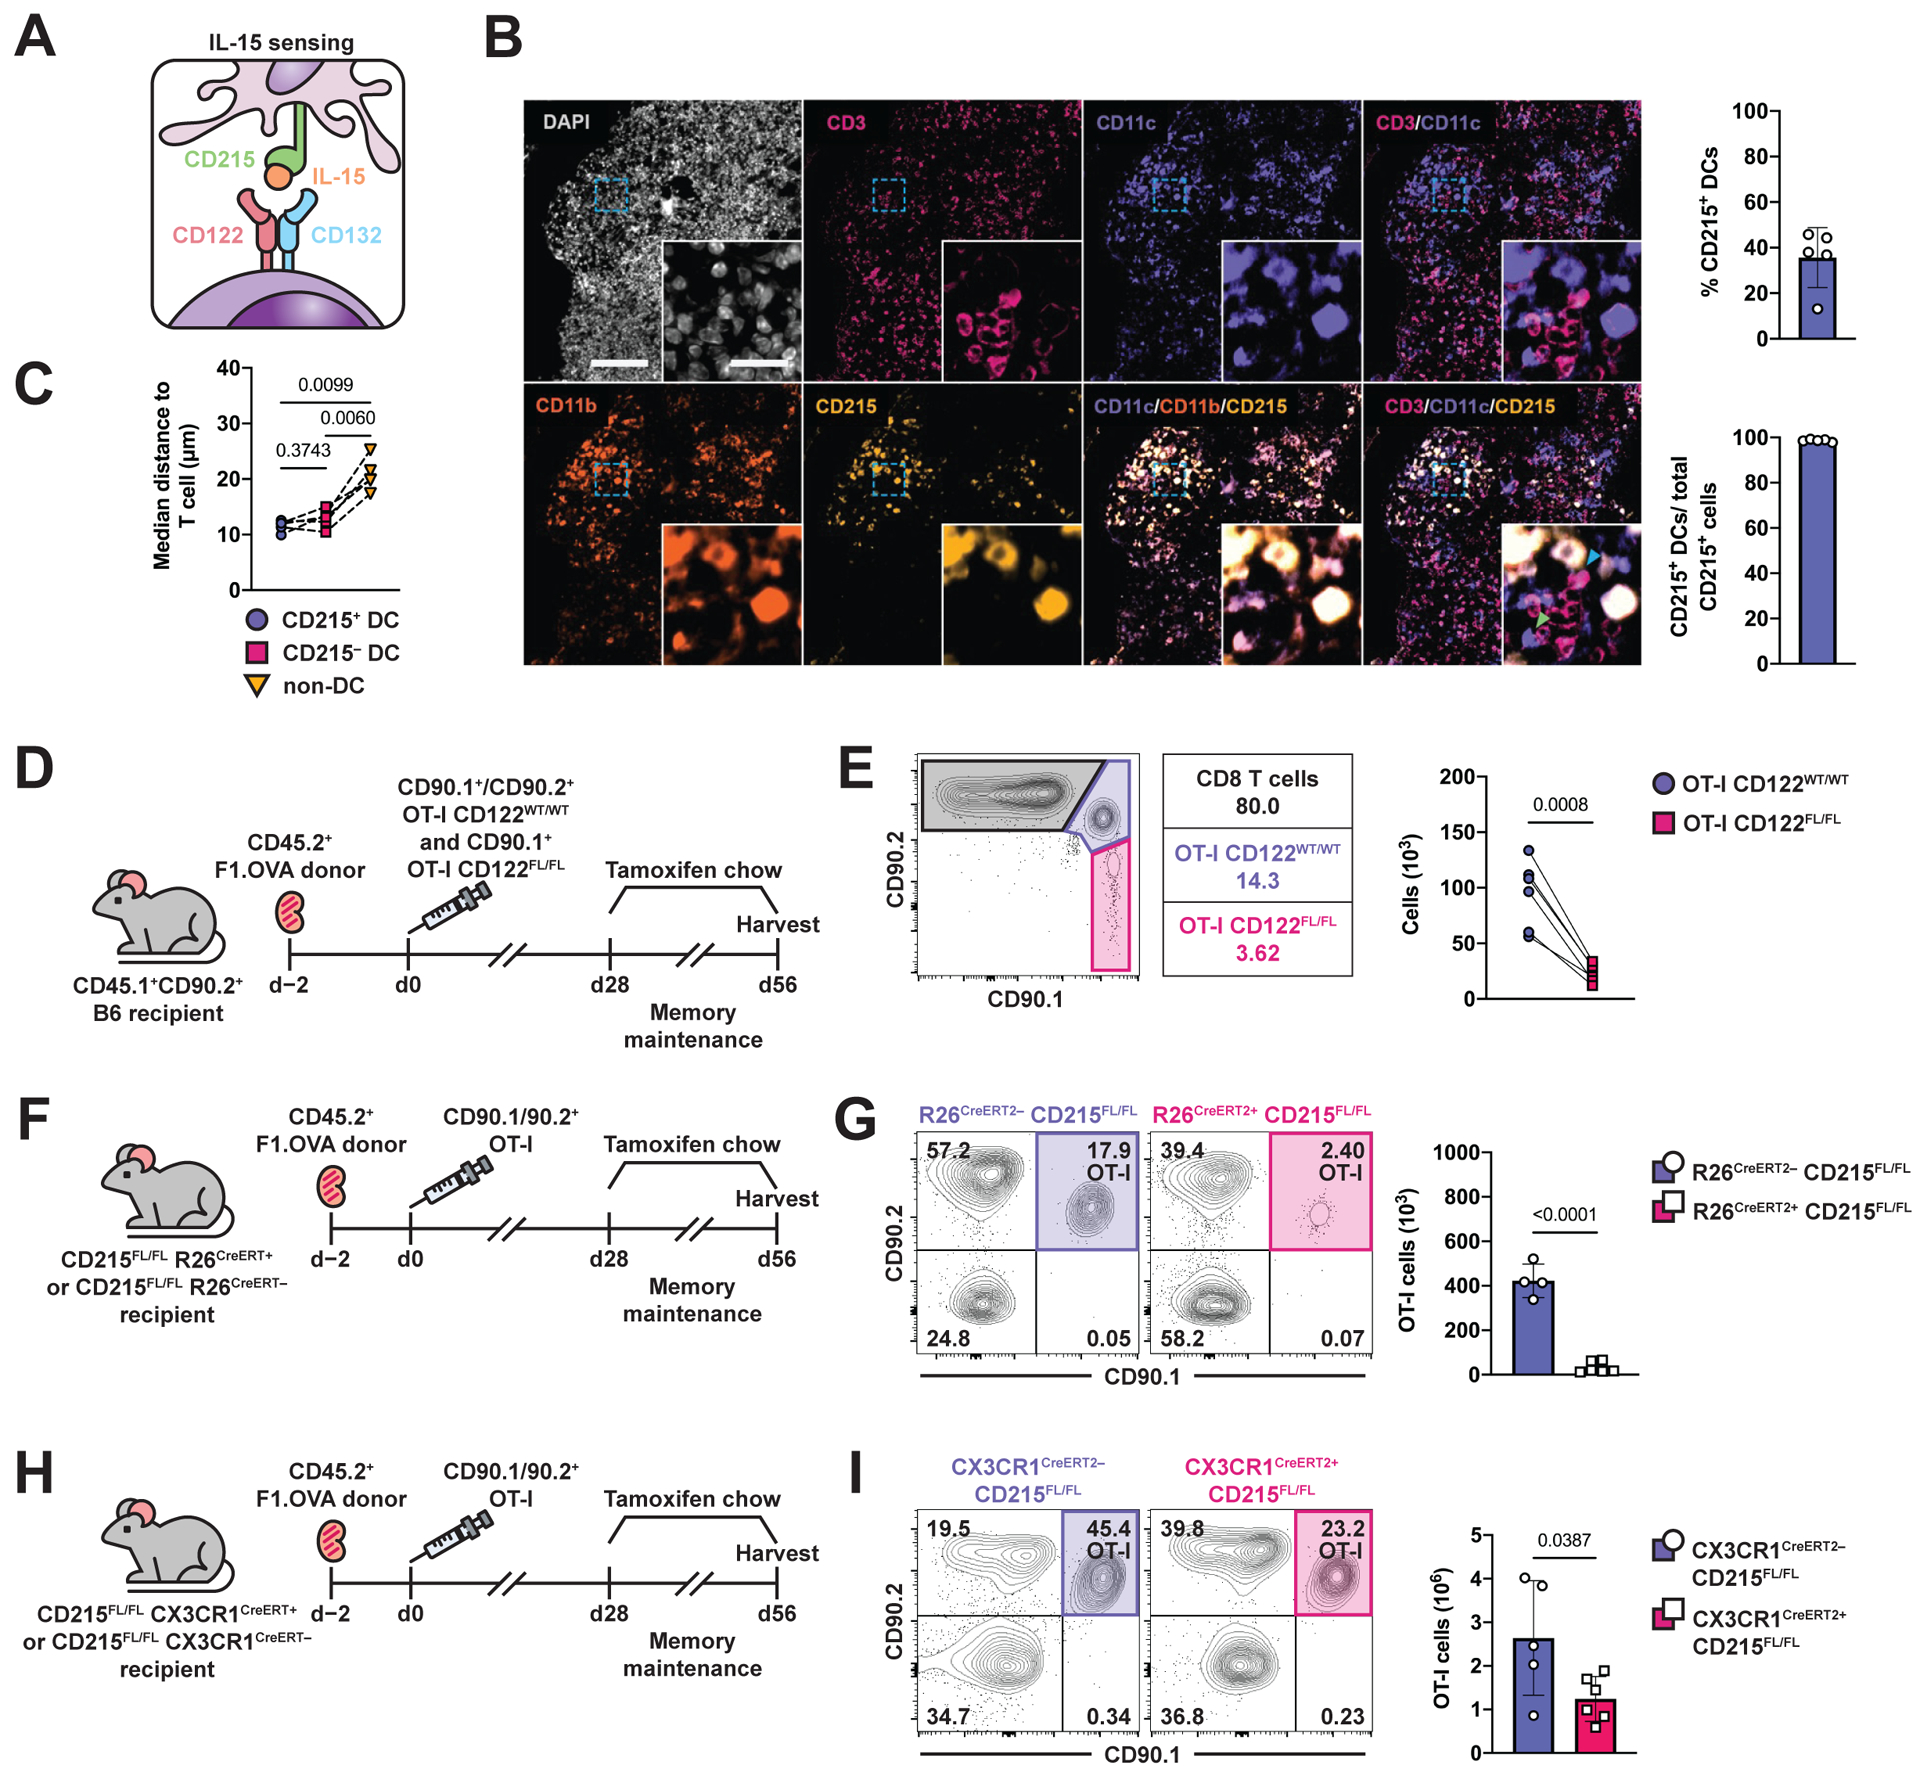
Fig. 6. TRM cell maintenance and function depends on local IL-15 signaling in renal allograft tissue.

(A) Schematic of IL-15 signaling.
(B) Multiplex immunofluorescence staining of F1.OVA renal allograft on day 56 post-transplantation for nuclei (DAPI, white), T cells (CD3, magenta), dendritic cells (CD11b/CD11c, purple/orange), and CD215 expression (yellow). Close proximity of CD3+ cell with CD11c+CD215+cell indicated by blue arrow. Close proximity of CD3+ cell with CD11c+CD215–cell indicated by green arrow. Percentage of APCs expressing CD215 and percentage of CD215-expressing APCs out of total CD215+ cells shown in graphs. Whole image scale bar: 200 μm. Cropped inset scale bar: 20 μm. n = 5 mice.
(C) Median distance of T cells from CD215+ APCs, CD215– APCs, and non-APCs.
(D) F1.OVA kidney allografts were transplanted into CD45.1+ B6 recipients followed by co-adoptive transfer of 1 × 10⁶ effector OT-I CD122WT/WT and effector OT-I CD122FL/FL R26CreERT2+ cells 2 days post-transplantation. Tamoxifen chow was introduced from days 28–56 post-transplantation, then recipients were subsequently harvested. Flow analysis was performed after gating on extravascular graft CD8+ T cells as shown in Fig. S1B. n = 6 mice.
(E) Representative flow plots and absolute number (graph) of TRM OT-I on d.56 following tamoxifen treatment.
(F) F1.OVA kidney allografts were transplanted into either CD215FL/FL R26CreERT2– or CD215FL/FL R26CreERT2+ B6 recipients followed by adoptive transfer of 1 × 10⁶ effector OT-I cells 2 days post-transplantation. Tamoxifen chow was introduced from days 28–56. n = 4–6 mice per group.
(G) Representative flow plots and absolute number (graph) of TRM OT-I cells on day 56 following tamoxifen treatment.
(H) F1.OVA kidney allografts were transplanted into either CD215FL/FL CX3CR1CreERT2– or CD215FL/FL CX3CR1CreERT2+ B6 recipients followed by adoptive transfer of 1 × 10⁶ effector OT-I cells 2 days post-transplantation. Tamoxifen chow was introduced from days 28–56. n = 5–6 mice per group.
(I) Representative flow plots and absolute number (graph) of TRM OT-I cells on day 56 following tamoxifen treatment.
P values were determined by (C) mixed-effects model with Tukey’s correction, (E) two-tailed paired t test, and (G, I) two-tailed unpaired t test.
