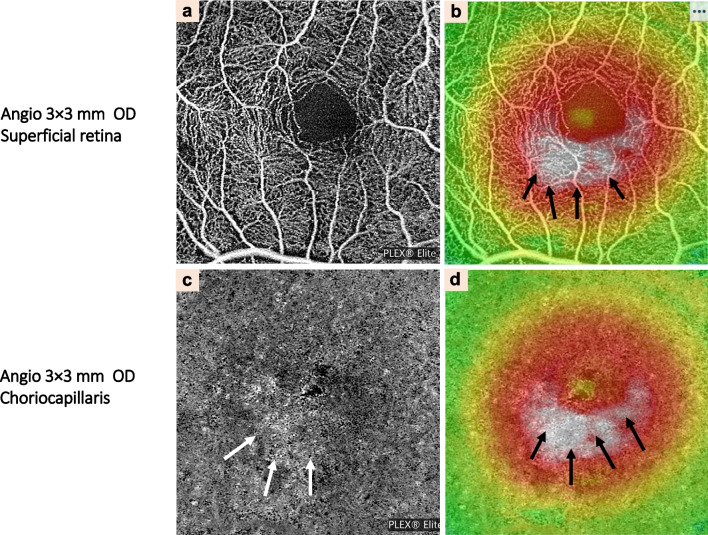
Fig. 6.
Clinical characteristics of central serous chorioretinopathy detected by optical coherence tomography angiography (OCTA). Automated segmentation of the superficial retina (at a range of 3 × 3 mm) showing foveal lesions on the topographic map. Focal protrusion of retinal pigment epithelium and high-density area of the choriocapillaris layer that corresponded to serous retinal detachment (black arrows) has also been noted (a, b). c Automated segmentation of the deep retina of the right eye. d Thickness map of automated segmentation of the deep retina of the right eye. The lesion which was showing by the white arrows in (c) and black arrows in (d) corresponded to serous retinal detachment which was indicated by black arrows in (b)

