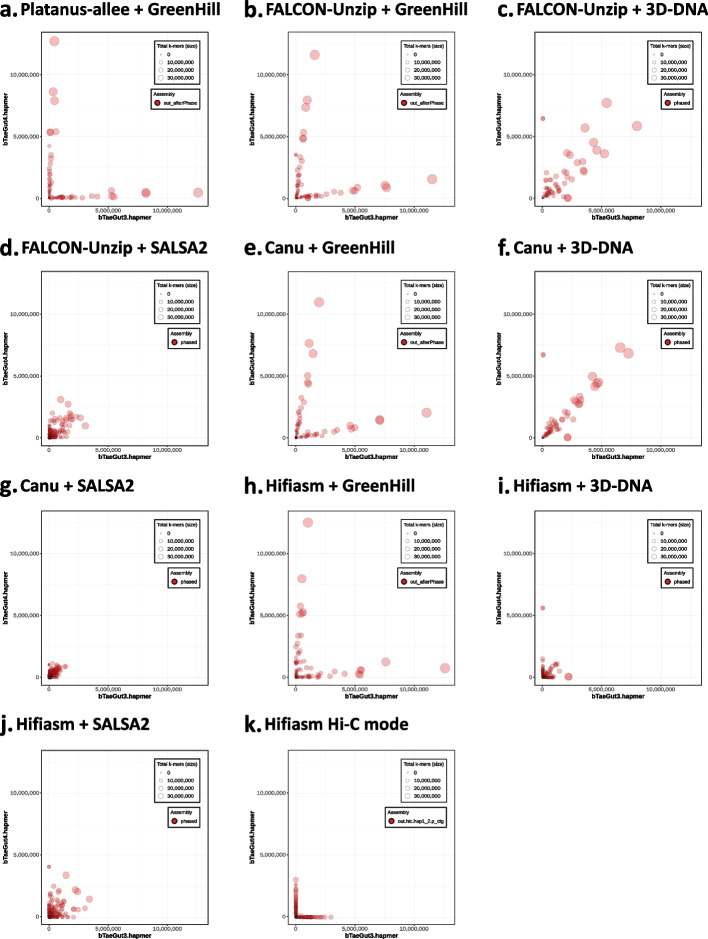
Fig. 4.
Hap-mer blob plots for zebra finch data. The numbers of hap-mers (parent-specific k-mer) from the mother and father are indicated on the x-axis and y-axis, respectively. The sizes of the circles indicate sequence lengths. The higher the phasing accuracy, the closer the circles are aligned to the axis. a Platanus-allee + GreenHill; b FALCON-Unzip + GreenHill result; c FALCON-Unzip + 3D-DNA result; d FALCON-Unzip + SALSA2 result; e Canu + GreenHill result; f Canu + 3D-DNA result; g Canu + SALSA2 result; h Hifiasm + GreenHill result; i Hifiasm + 3D-DNA result; j Hifiasm + SALSA2 result; k Hifiasm Hi-C mode result

