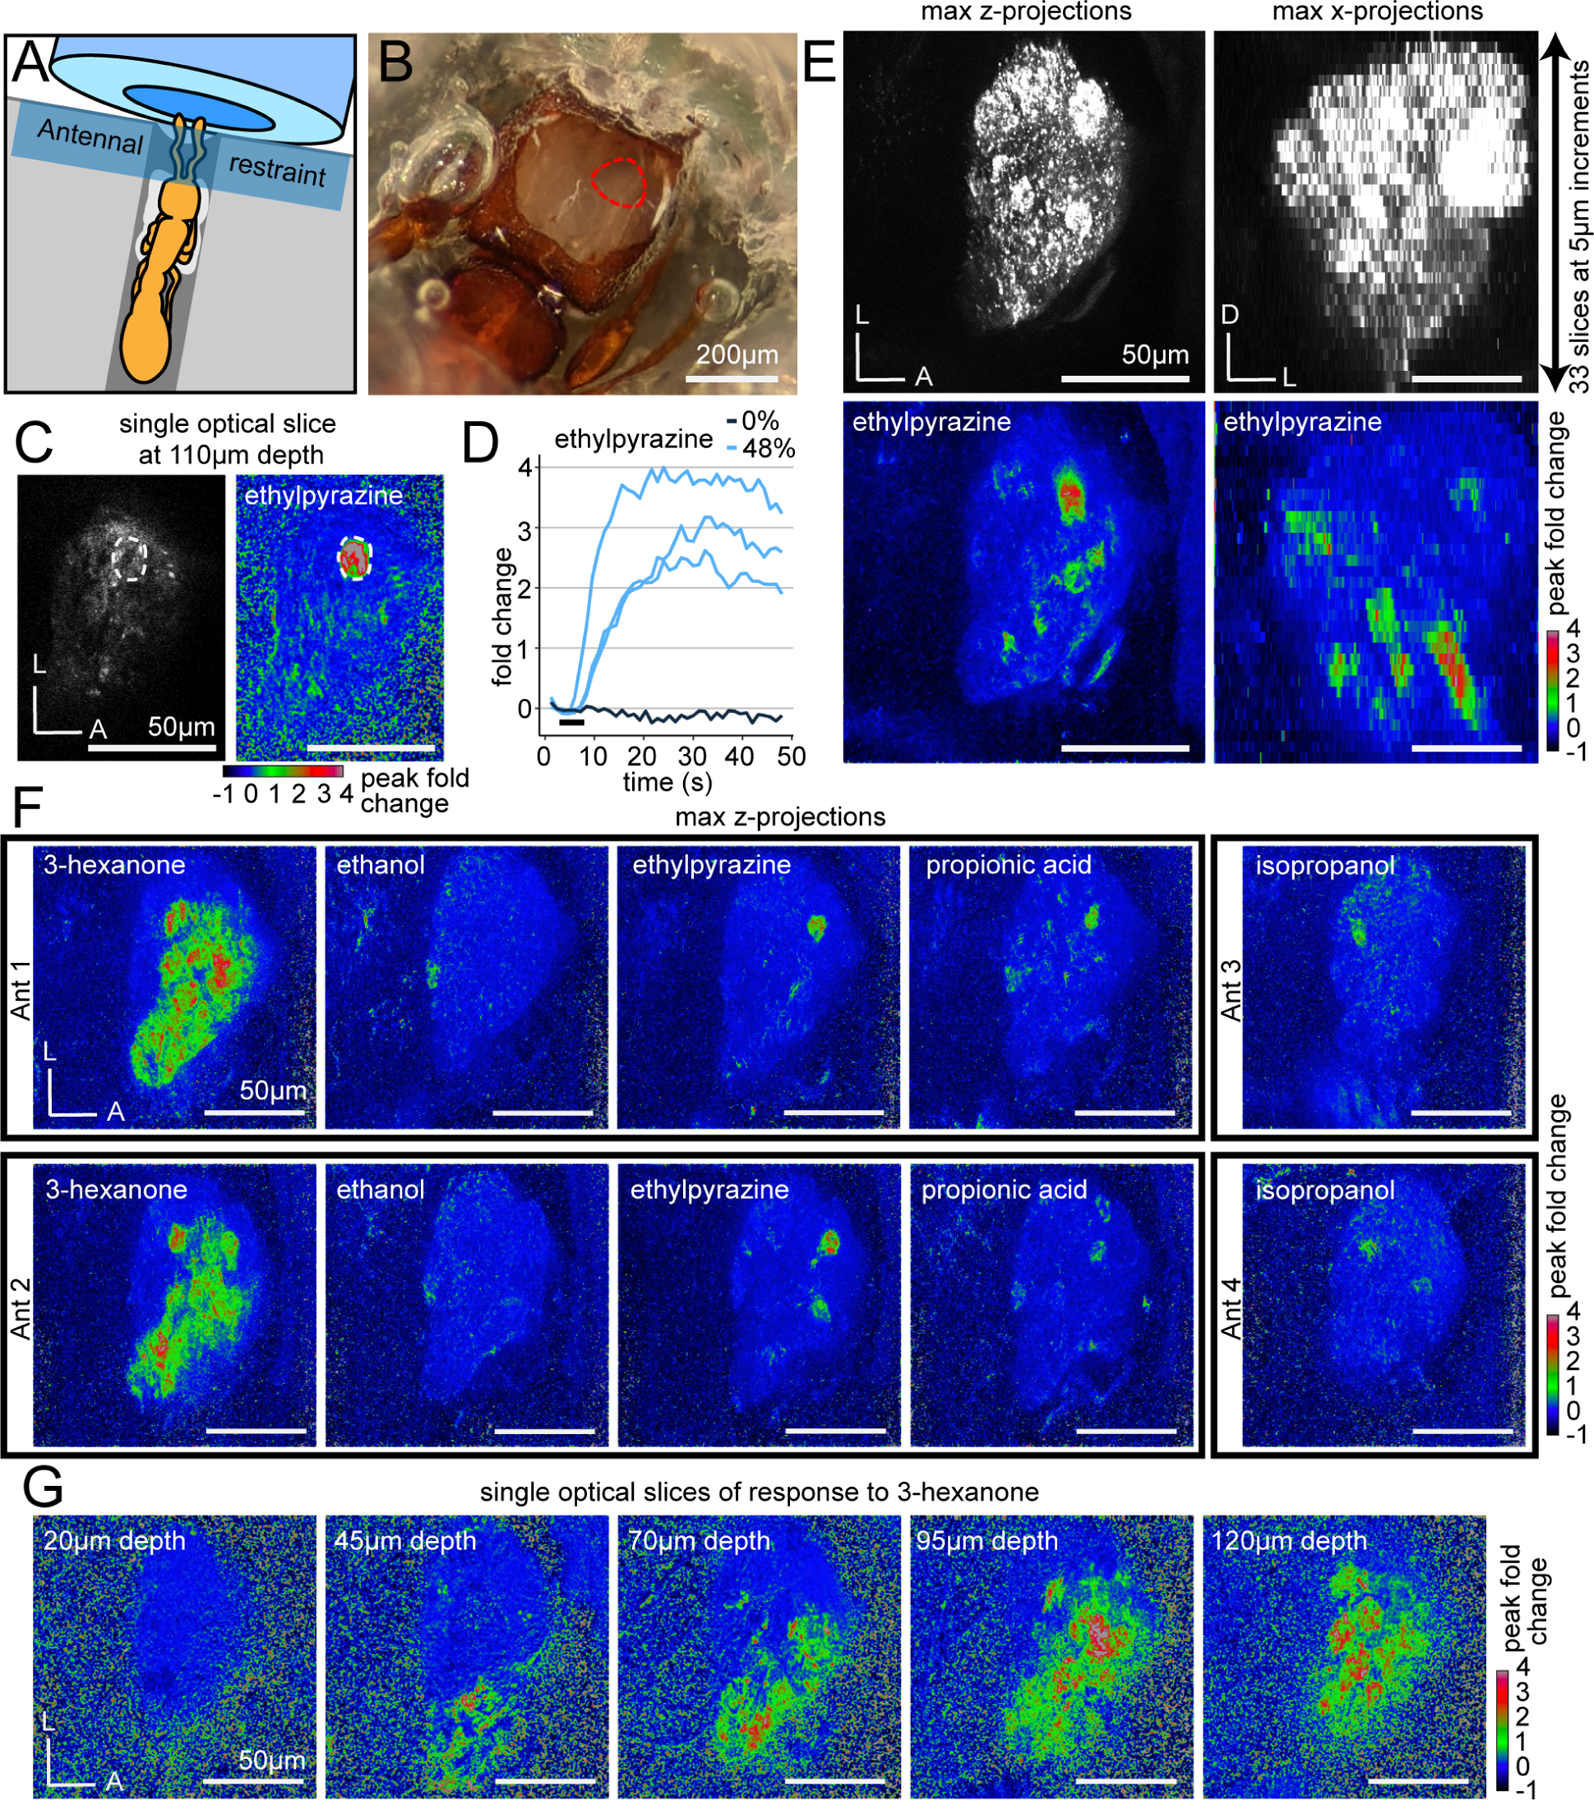
Figure 3. Imaging odor-evoked calcium responses in the antennal lobe.

(A) Ant adhered to a plastic base with glue (white). A Parafilm strip restrains the antennae in front of the air tube. (B) Cuticle and glandular tissue are removed to expose the AL (red outline). (C) Single optical slice through the AL using two-photon microscopy showing raw fluorescence (left, brightness and contrast enhanced) and the peak fold change of fluorescence after a 5s odor presentation at 48% concentration (right). A single glomerulus of interest is circled. (D) Time series of calcium responses in the glomerulus from (C) from trials with ethylpyrazine or paraffin oil vehicle (0%); black bar indicates the 5s odor presentation. (E) Volumetric imaging of clonal raider ant ALs. Raw GCaMP6s fluorescence (top) in max z-projection (left) and max x-projection (right); responding glomeruli are visible throughout the volume (bottom) after presentation with ethylpyrazine (48%). (F) Responses to general odorants in different individuals. (G) Responses to 3-hexanone in five different optical slices. See Table S3 for vapor pressures of general odorants. D: dorsal; L: lateral; A: anterior.
