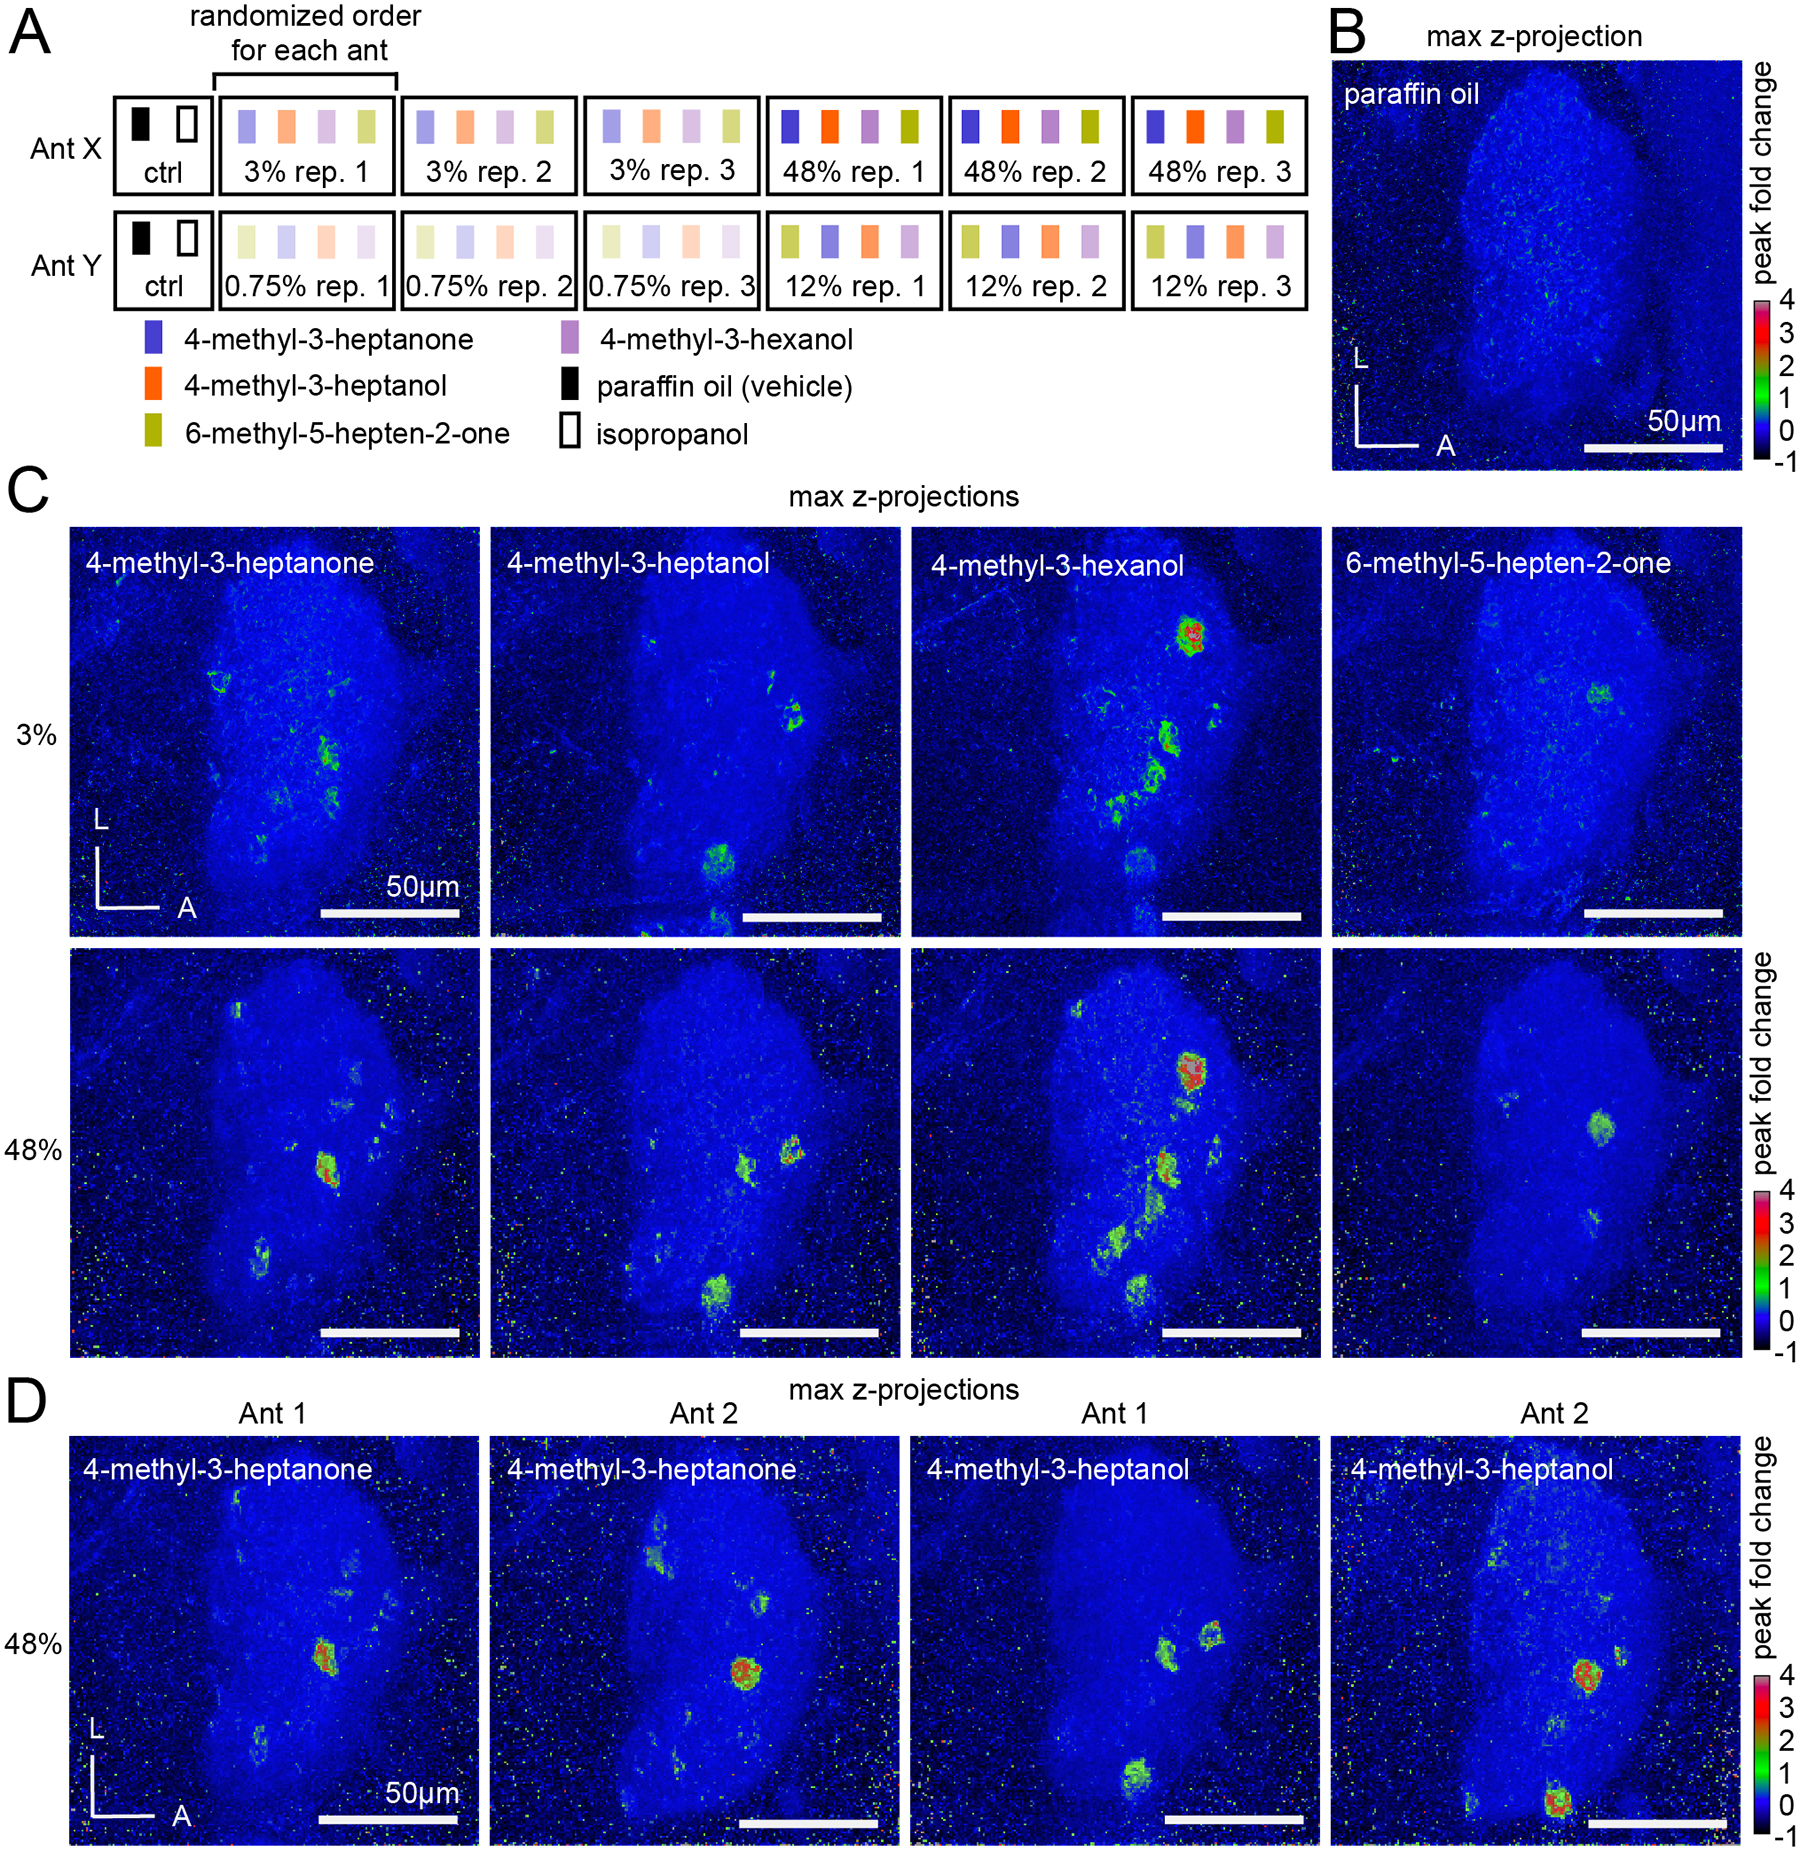
Figure 4. The representation of alarm pheromones in the antennal lobe.

(A) Cartoon of the odor stimulus regime, with two ants shown as examples. Four alarm pheromone concentrations were tested in total (0.75%, 3.0%, 12.0%, and 48.0% v/v), but each individual ant was exposed to only two out of the four possible concentrations. (B) The paraffin oil vehicle does not generate calcium responses. (C) Representative max z-projections of peak fold changes from a single ant in response to four alarm pheromones at 3% and 48% concentrations. (D) Two different individuals stimulated with 4-methyl-3-heptanone (left) and 4-methyl-3-heptanol (right) at high (48%) concentration. See Fig. S4 for additional characterization of calcium responses. See Fig. S5 for quantification of numbers of responding glomeruli. See Table S3 for vapor pressures of alarm pheromones. L: lateral; A: anterior.
