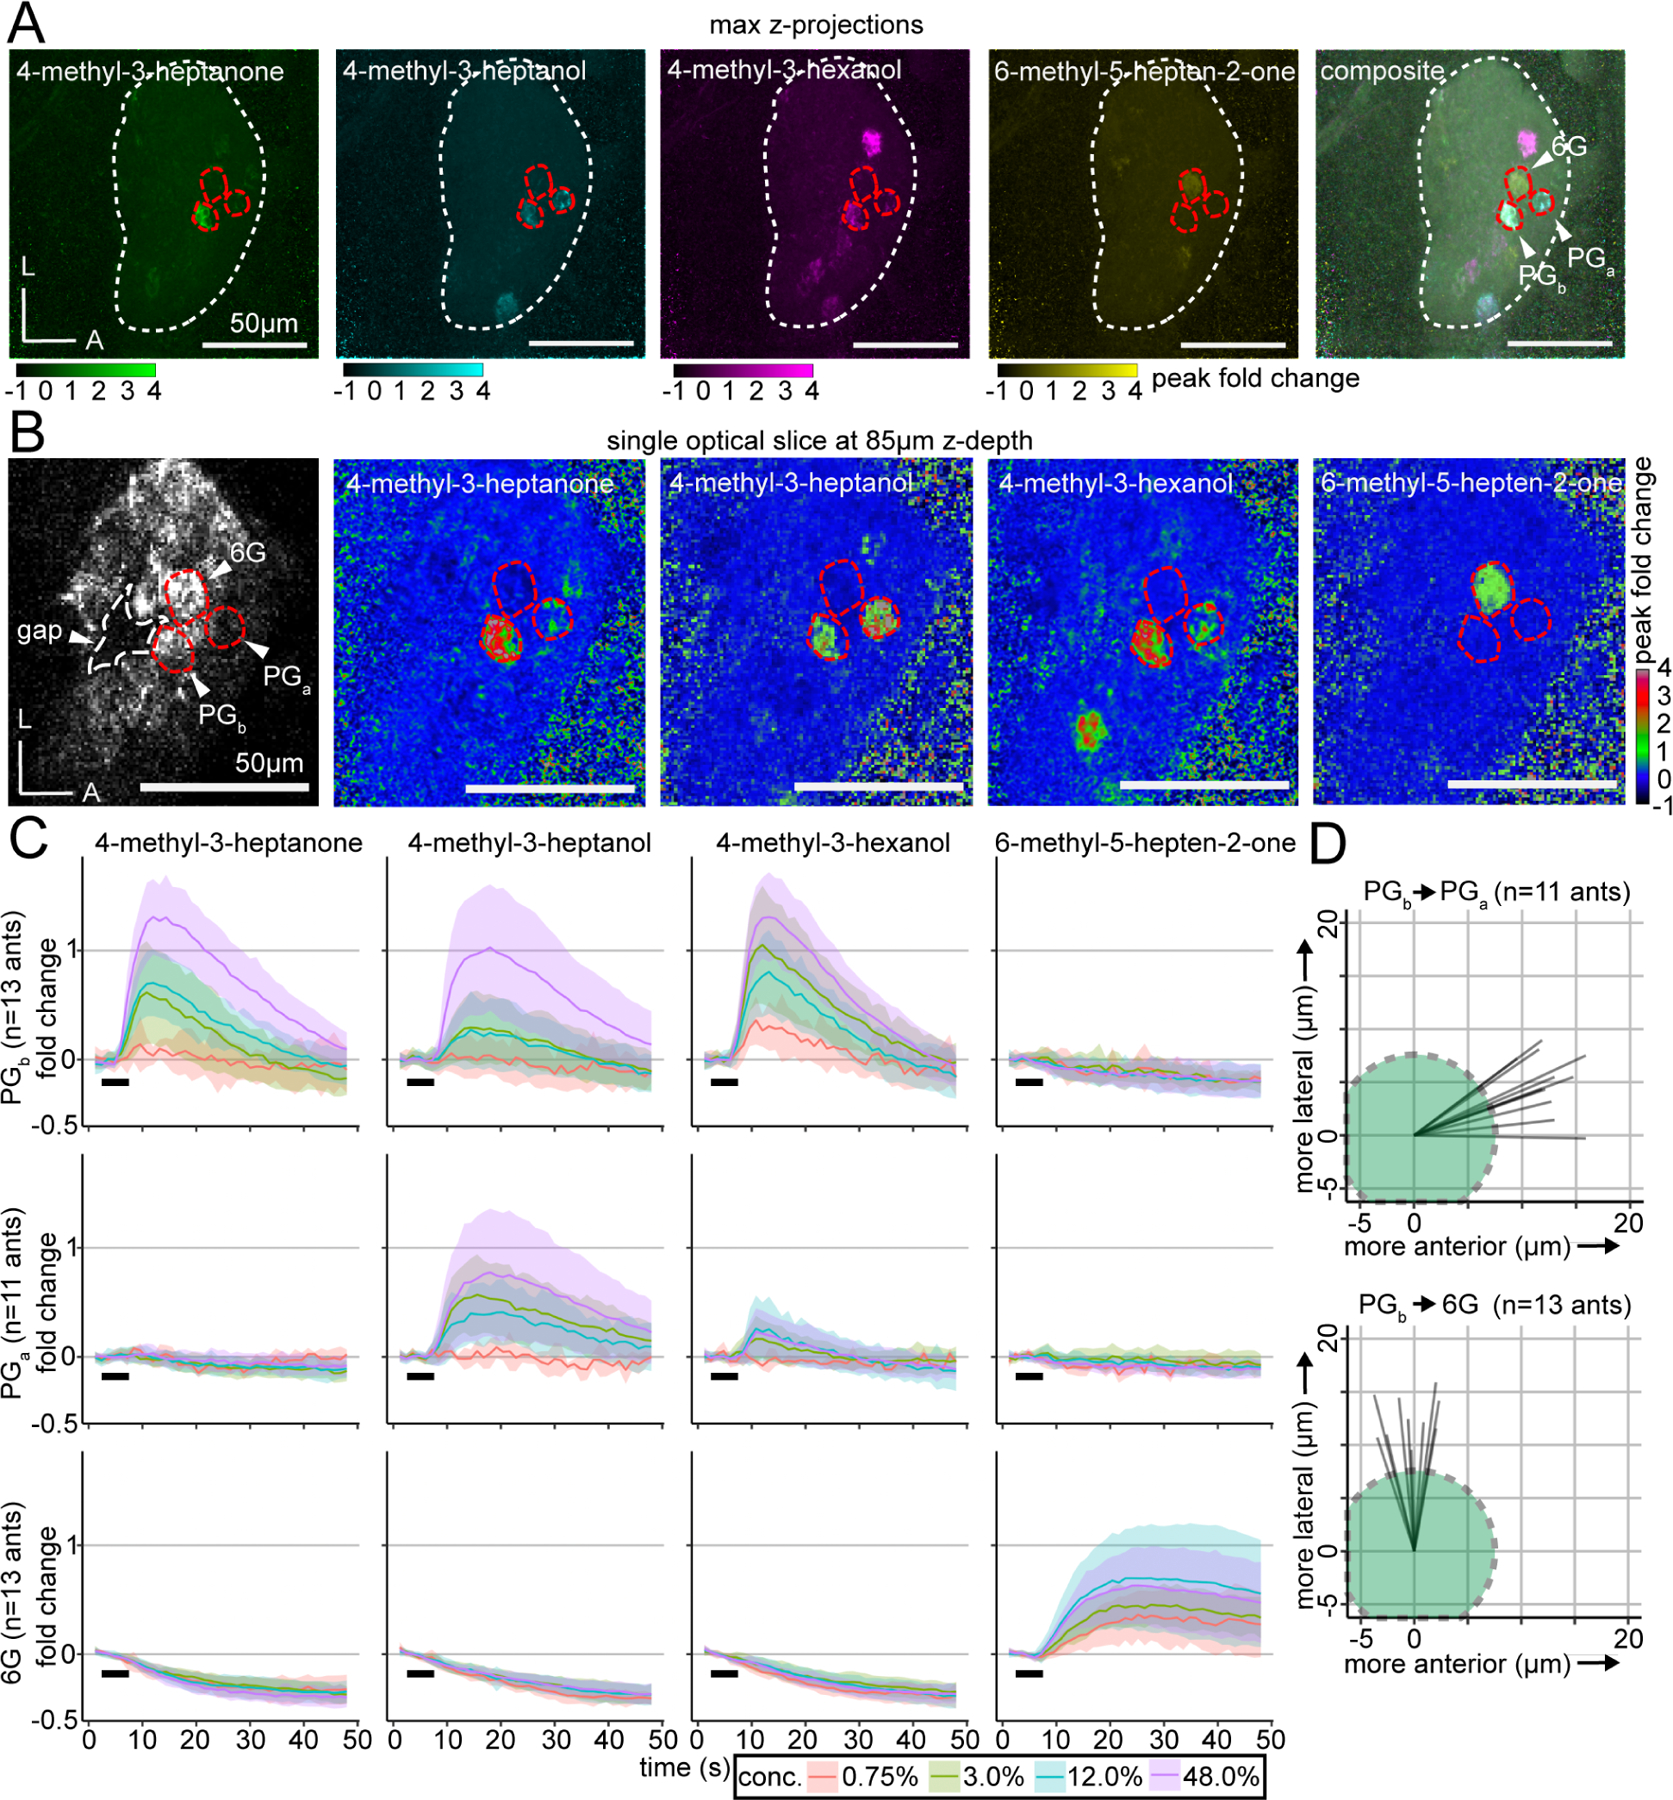
Figure 5. A glomerular cluster with stereotyped spatial organization and robust responses to alarm pheromones.

(A) Whole-AL activation patterns for alarm pheromones overlap in several glomeruli. Three focal glomeruli are outlined in red. (B) Single optical slice through the AL with the three focal glomeruli, which are adjacent to an AL region lacking glomeruli (“gap”; outlined in white). Fluorescence with enhanced brightness/contrast (left). Peak fold change in response to odors (right four panels). See Fig. S5 for quantifications of responding glomerulus numbers at different concentrations, and Fig. S6 for peak calcium response quantifications. (C) Time series of calcium responses in PGb (top), PGa (middle), and 6G (bottom); mean±SD. Black bars indicate the 5s odor presentation. See Fig. S7 for extended time series of responses to 6-methyl-5-hepten-2-one in 6G. (D) Vectors of the spatial displacement between the centers of the PGb and PGa (top), and between the PGb and 6G (bottom) glomeruli. Green circles represent a typical 15μm-diameter glomerulus, for scale. L: lateral; A: anterior.
