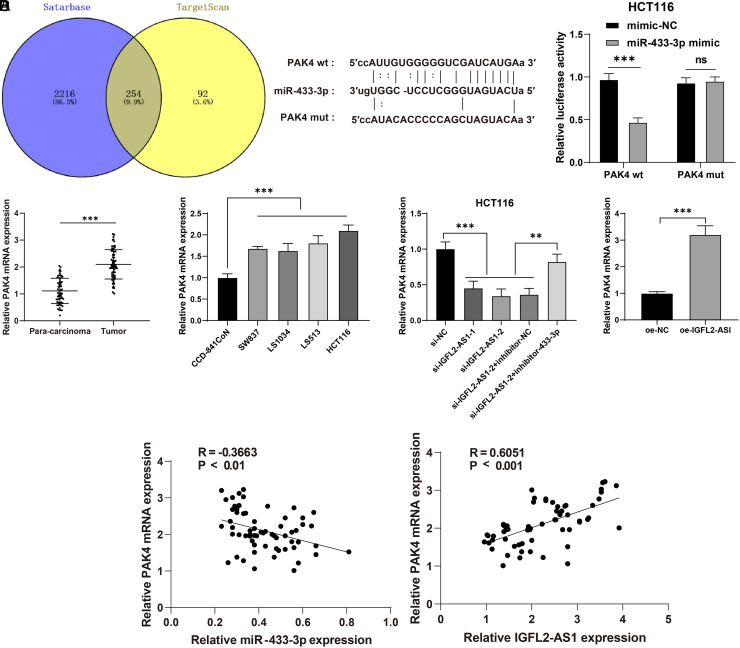
Figure 5.
miR-433-3p inhibited PAK4 transcription. (A) Downstream target genes of miR-433-3p was screened by Starbase and TargetScan databases, and intersections were identified. (B) The binding relationship between PAK4 and miR-433-3p was testified via the dual-luciferase reporter gene assay. (C) mRNA level of PAK4 in CRC tissues (n = 63) (left) and cell lines (CCD-841CoN, SW837, LS1034, LS513, and HCT116) (middle) and all experimental groups (right) was determined via qRT-PCR. (D) Correlation analysis of miR-433-3p and PAK4 mRNA, lncRNA IGFL2-AS1 and PAK4 mRNA. Cell experiments were performed 3 times independently. Data were represented as mean ± SD, ns: P > .05, ***P < .001, **P < .01. Data in figure B were analyzed using 2-way ANOVA, data in figure C were analyzed using paired t-test (left and right) and 1-way ANOVA (middle), followed by Tukey’s multiple comparison test. Data in figure D were analyzed using Pearson’s correlation coefficient. SD, standard deviation; ANOVA, analysis of variance; lncRNA IGFL2-AS1, long noncoding RNA insulin-like growth factor 2-like family member 2 antisense RNA 1; PAK4, p21 (RAC1)-activated kinase 4.

 Content of this journal is licensed under a