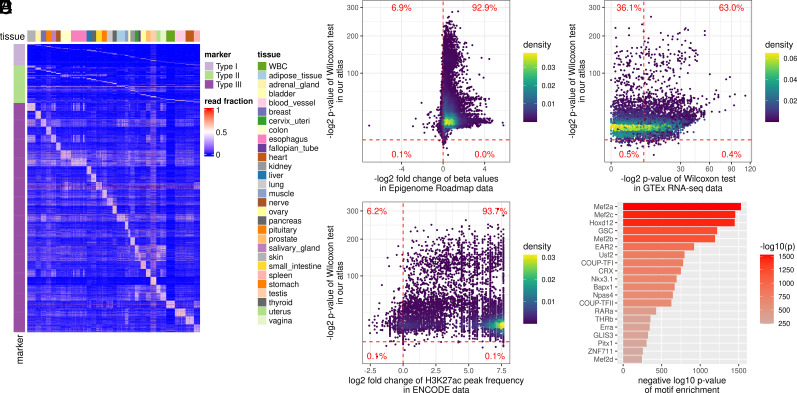
Fig. 2.
Construction and validation of the tissue-specific methylation atlas. (A) Heatmap of three types of tissue-specific markers used in the tissue deconvolution (i.e., the top-ranked tissue markers in the methylation atlas). The methylation atlas consists of the tissue markers that distinguish 29 human tissues. The tissue markers were identified by three strategies (Materials and Methods): Type I markers from the one-tissue-vs.-the-rest strategy (Top); Type II markers from the one-group-vs.-the-another-group strategy using the tissue phylogeny (Middle), and Type III markers from the one-tissue-vs.-another-tissue strategy (Bottom). The color in the heatmap showed the fraction of the tissue-specific fragments out of all fragments at a marker (referred to as the read fraction). (B) Validation of the reproducibility of the identified tissue markers in Epigenome Roadmap data. For each marker, from the RRBS data of our tissue samples, we performed the one-sided Wilcoxon rank-sum test between the corresponding tissues (comparing lowly with highly methylated tissues); on the WGBS data from the Epigenome Roadmap project, we calculated the fold change of the beta values between the corresponding tissues. Each point in the figure corresponds to a marker. The vertical dashed line showed a fold change of 1. The points on the right side of the vertical dashed line represented the markers with fold change <1, indicating a consistent methylation pattern with our RRBS data. The horizontal dashed line indicated a significant P value (<0.01). (C) Marker association with tissue-specific H3K27ac modification. For each marker, on the H3K27ac ChIP-seq data from the ENCODE project, we calculated the fold change of the H3K27ac peak frequency between the corresponding tissues. Each point in the figure corresponds to a marker. The vertical dashed line indicated that the fold change was 1. The horizontal dashed line indicated a significant P value (<0.01). (D) Marker association with tissue-specific transcription. For each marker, on the RNA-seq data from the GTEx project, we performed the Wilcoxon rank-sum test between the corresponding tissues. Each point in the figure corresponds to a marker. The vertical and horizontal dashed lines indicated a significant P value (<0.01). (E) Marker association with tissue-specific transcription regulation. We analyzed the enrichment of transcription factor binding motifs at the marker regions using HOMER. The top 20 enriched motifs and their P values were shown in the figure.

