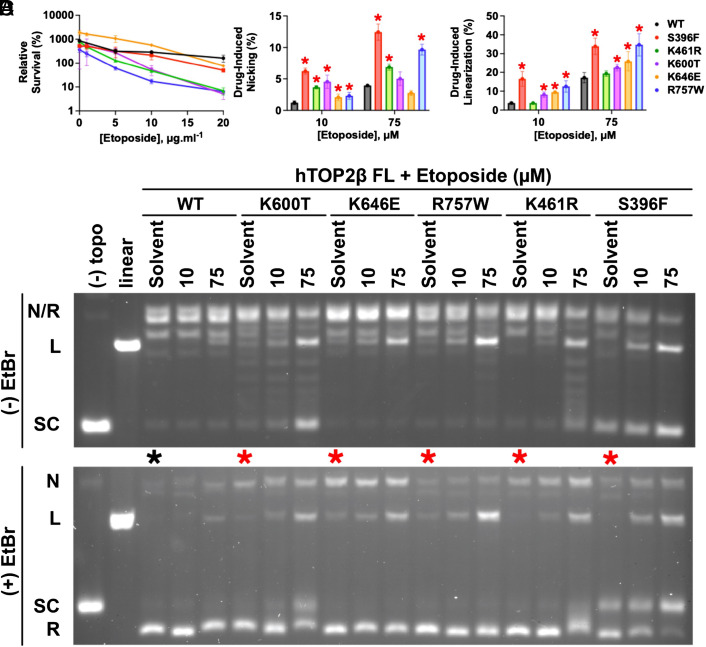
Fig. 1.
Characterization of etoposide-hypersensitive hTOP2β mutants. (A) The top2-4 host strain YMM10t2-4 was transformed with hTOP2β plasmids containing the indicated alleles. Transformants were grown to mid-log phase in SC-Ura medium at 34 °C, after which the indicated concentration of etoposide was added. Incubation was continued for an additional 24 h before plating cells for survival. The survival plotted is relative to that at the time of etoposide addition. Error bars are ±SEM. (B and C) Summary of DNA linearization and nicking activity by EtopHS hTOP2β mutants induced by etoposide, as quantified by densitometry of agarose-gel-resolved cleavage products. Error bars represent the SD from three experimental replicates. Mutants showing elevated nicking or linearization relative to wild-type hTOP2β (as determined by a one-tailed t test with a P-value threshold of 0.05) are denoted with a red asterisk. (D) Representative agarose gels of supercoil relaxation and cleavage reactions conducted in the presence of etoposide. The activities of five candidate mutants from the EtopHS screen are shown in the presence of two different drug concentrations (10 and 75 μM) as compared to no drug (“Solvent”). Gels were electrophoresed in the absence (Upper) or presence (Lower) of ethidium bromide (“EtBr"). Control reactions [“(−) topo” (no enzyme) and “linear”] are included at the left of each gel. The innate cleavage propensities of the constructs can be seen in lanes denoted with asterisks (black—WT (wild type), red—mutant). The positions of different DNA species as they migrate into the gels are noted: “N/R”—nicked/relaxed; “L”—linear; “SC”—supercoiled.

