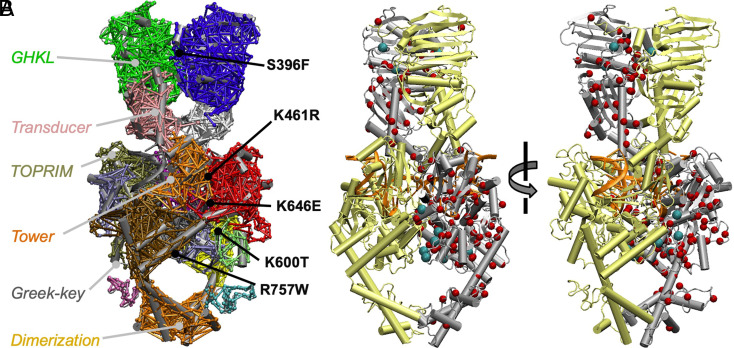
Fig. 4.
Identifying prospective hypercleavage mutants of hTop2β computationally. (A) Network communities obtained for an hTOP2β•AMPPMP•DNA ternary complex homology model. The positions of the EtopHS mutations studied here are indicated. Nodal (interresidue) interactions are shown as bars connecting different parts of a cartoon rendering of the complex and are colored by community assignment: GHKLa (green), GHKLb (blue), transducera (pink), transducerb (white), TOPRIMa1 (red), TOPRIMa2 (ice blue), TOPRIM+GreekKeya (tan), TOPRIMb (red), GreekKeya (lime), WHDa (black), WHDb (gray), towera (purple), towerb (dark orange), shouldera (yellow), shoulderb (ochre), C-terminal loopa (cyan), C-terminal loopb (mauve), C-terminal dimerization interface (light orange). (B) Cartoon diagram of an hTOP2β•AMPPNP•DNA ternary complex homology model with cancer dataset mutation sites indicated as red spheres. Sites chosen for further study are indicated as cyan spheres.

