Figure 1.
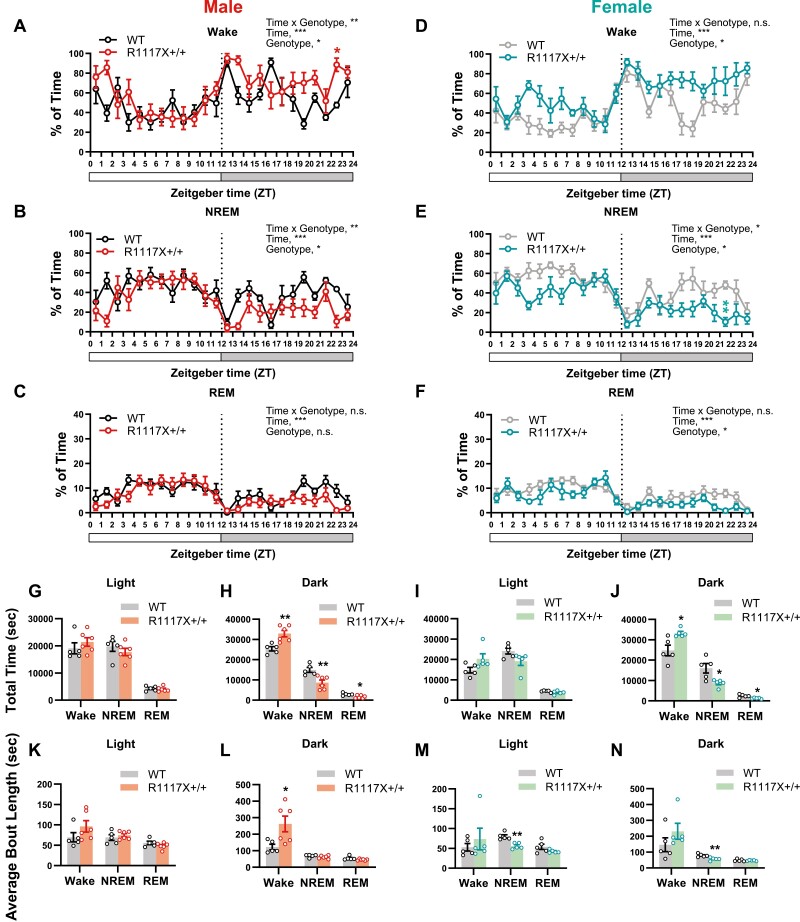
Adolescent sleep architecture in male and female R1117X mice. (A–F) Hourly percentage of wake (A, D), NREM (B, E), and REM (C, F) sleep in adolescent R1117X+/+ mice and WT littermates (P37–40) over a 24-hour light–dark cycle. Data from the male animals are shown in (A–C, n = 5 in WT; 6 in R1117X+/+), and data from the females are in (D–F, n = 5 each). RM two-way ANOVA, Time × Genotype (A) F (23, 207) = 2.17, p = 0.002, (B) F (23, 207) = 1.98, p = 0.006, (C) F (23, 207) = 1.27, p = 0.20, (D) F (23, 184) = 1.54, p = 0.06, (E) F (23, 184) = 1.74, p = 0.02, (F) F (23, 184) = 1.36, p = 0.13; Genotype (A) F (1, 9) = 8.53, p = 0.02, (B) F (1, 9) = 8.90, p = 0.02, (C) F (1, 9) = 4.05, p = 0.08, (D) F (1, 8) = 9.20, p = 0.02, (E) F (1, 8) = 6.97, p = 0.03, (F) F (1, 8) = 9.69, p = 0.01, followed by Bonferroni’s post-tests between genotypes (A) ZT22-23, * p = 0.03, (E) ZT21-22, ** p = 0.006, all other timepoints, n.s. (G–J) Total amount of time in wake, NREM and REM states during the light phase and dark phase in male (G, H, n = 5 in WT; 6 in R1117X+/+) and female (I, J, n = 5 each) animals. Welch’s t-test between genotypes, (H) Wake, t = 3.92, df = 8.40, ** p = 0.004; NREM, t = 3.56, df = 9.00, ** p = 0.006; REM, t = 2.88, df = 8.95, * p = 0.02, (J) Wake, t = 3.05, df = 4.96, * p = 0.03; NREM, t = 2.95, df = 4.96, * p = 0.03; REM, t = 3.32, df = 5.06, * P = 0.02. (K–N) Average length of wake, NREM and REM bouts during the light phase and dark phase in male (K, L, n = 5 in WT; 6 in R1117X+/+) and female (M, N, n = 5 each) animals. Welch’s t-test between genotypes, (L) Wake, t = 2.79, df = 6.21, * p = 0.03, (M) NREM, t = 4.64, df = 7.78, ** p = 0.002, (N) NREM, t = 3.64, df = 7.89, ** p = 0.007. Data are shown as mean ± s.e.m. All tests were two-sided. For this and all following figures, * p < 0.05; ** p < 0.01; *** p < 0.001; n.s., not significant, p > 0.05.

