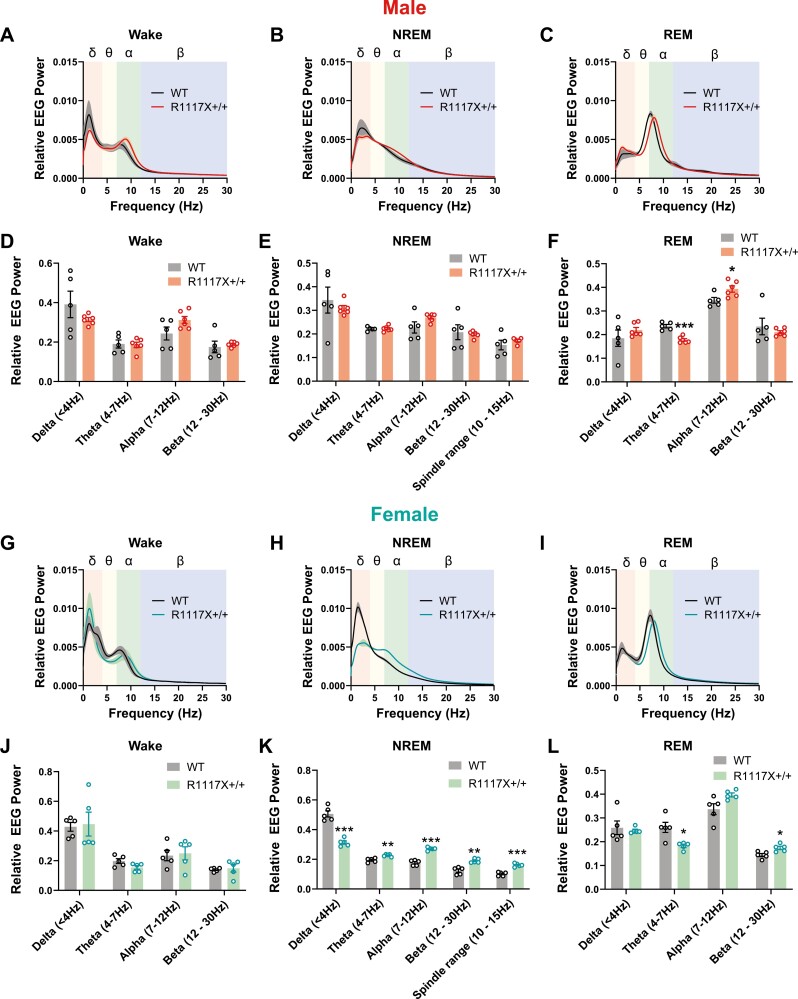
Figure 2.
EEG power spectrum of adolescent male and female R1117X mice. (A–F) Relative EEG power was calculated as the fraction of total power at 0–30 Hz, and power spectrum was plotted for wake (A), NREM (B) and REM (C) states over a 24-hour light–dark cycle in adolescent male R1117X+/+ mice (n = 6) and WT littermates (n = 5). Relative EEG power in each frequency band was quantified for wake (D), NREM (E) and REM (F) states. Welch’s t-test between genotypes, (F) Theta, t = 6.37, df = 7.71, *** p = 0.0003; Alpha, t = 2.65, df = 9.00, * p = 0.03, all other comparisons, p > 0.05. (G–L) Relative EEG power spectrum and quantifications of each frequency band in adolescent female R1117X+/+ mice and WT littermates (n = 5 each). Welch’s t-test between genotypes, (K) Delta, t = 8.04, df = 6.13, *** p = 0.0002; Theta, t = 4.49, df = 6.50, ** p = 0.003; Alpha, t = 9.996, df = 6.44, *** p = 0.00003; Beta, t = 5.30, df = 6.52, ** P = 0.001; Spindle range, t = 7.61, df = 7.85, *** p = 0.00007; (L) Theta, t = 3.46, df = 4.78, * p = 0.02; Beta, t = 3.11, df = 7.98, * p = 0.01, all other comparisons, p > 0.05. Data are shown as mean ± s.e.m. Shaded area in (A–C) and (G–I) indicates s.e.m. All tests were two-sided.

