Figure 3.
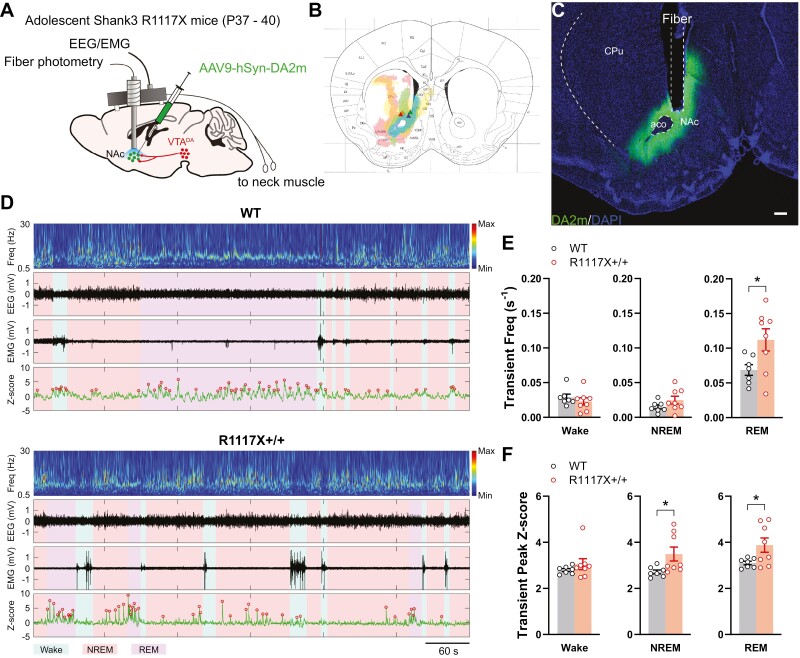
Dopamine release in the NAc of adolescent R1117X mice in sleep/wake states. (A) R1117X+/+ mice and WT littermates received AAV9-hSyn-DA2m in the NAc with an optical fiber placed slightly above the injection site and electrode implantation for EEG/EMG recording at P28–30. Simultaneous fiber photometry and EEG/EMG recording were performed at P37–40. (B) Infection areas (shaded) of AAV9-hSyn-DA2m around the optical fibers from four animals were mapped to the mouse brain atlas image. Atlas source: [48]. Colored triangles indicate fiber tips. (C) Representative image showing the expression of DA2m in the NAc stained using an anti-GFP antibody (Abcam, # ab13970, chicken, 1:1000) and optical fiber placement. CPu, caudal putamen; NAc, nucleus accumbens; aco, anterior commissure. Scale bar, 200 µm. (D) Representative traces of DA2m signal (bottom row, green) aligned with the heatmap indicating EEG power (top row), EEG (second row) and EMG (third row). The color background indicates wake (cyan), NREM (pink) or REM (purple) states. Red circles on DA2m traces indicate transient peaks detected. (E) The frequency of dopamine transients detected in each state. n = 7 in WT; 8 in R1117X+/+. Welch’s t-tests, REM, t = 2.44, df = 9.92, * p = 0.03. (F) Peak amplitude (Z-score) of detected transients was first averaged within each animal and then compared across animals. n = 7 in WT; 8 in R1117X+/+. Welch’s t-tests, NREM, t = 2.462, df = 8.052, * p = 0.04; REM, t = 2.424, df = 7.871, * p = 0.04. Data are shown as mean ± s.e.m. All tests were two-sided.

