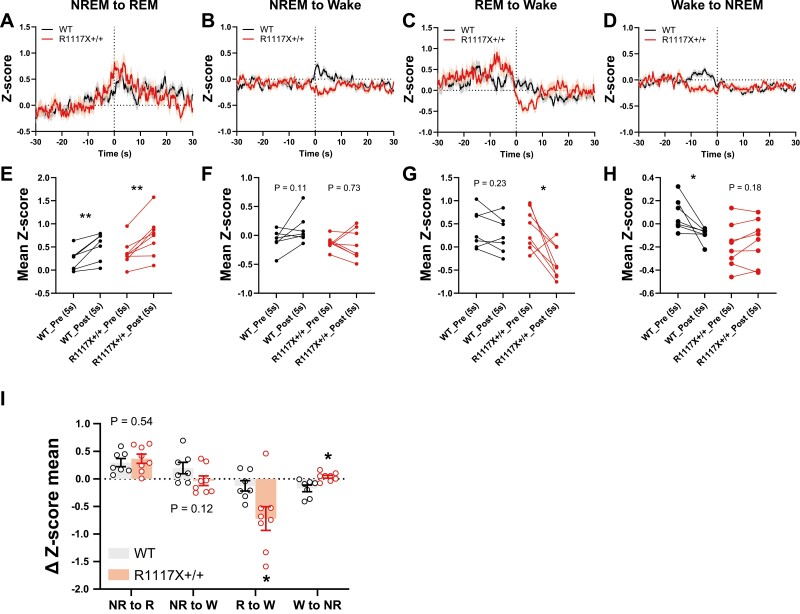
Figure 4.
Dopamine release in the NAc of adolescent R1117X mice during state transitions. (A–D) DA2m traces during the transitions indicated were averaged from all trials (58–195 trials each). 0 seconds indicates time of transition. Shaded area indicates s.e.m. (E–H) Comparison of mean DA2m signal during 5 seconds pre- and post-transition. Paired dots represent data from the same animal (n = 7 mice in WT; 8 mice in R1117X+/+, all trials averaged). Paired t-tests, (E) WT, t = 4.05, df = 6, ** p = 0.007; R1117X+/+, t = 4.42, df = 7, ** p = 0.003, (F) WT, t = 1.91, df = 6, p = 0.11; R1117X+/+, t = 0.36, df = 7, p = 0.73, (G) WT, t = 1.33, df = 6, p = 0.23; R1117X+/+, t = 3.33, df = 7, * p = 0.01, (H) WT, t = 2.87, df = 6, * p = 0.03; R1117X+/+, t = 1.47, df = 7, p = 0.18. (I) Changes in DA2m signal (∆Z-score) between pre- and post-transition stage. n = 7 mice in WT; 8 mice in R1117X+/+. NR, NREM; R, REM; W, wake. Welch’s t-tests within each category, NR to R, t = 0.64, df = 12.97, p = 0.54; NR to W, t = 1.69, df = 12.24, p = 0.12; R to W, t = 2.52, df = 9.51, * p = 0.03; W to NR, t = 3.22, df = 8.38, * p = 0.01. Data are shown as mean ± s.e.m. All tests were two-sided.

