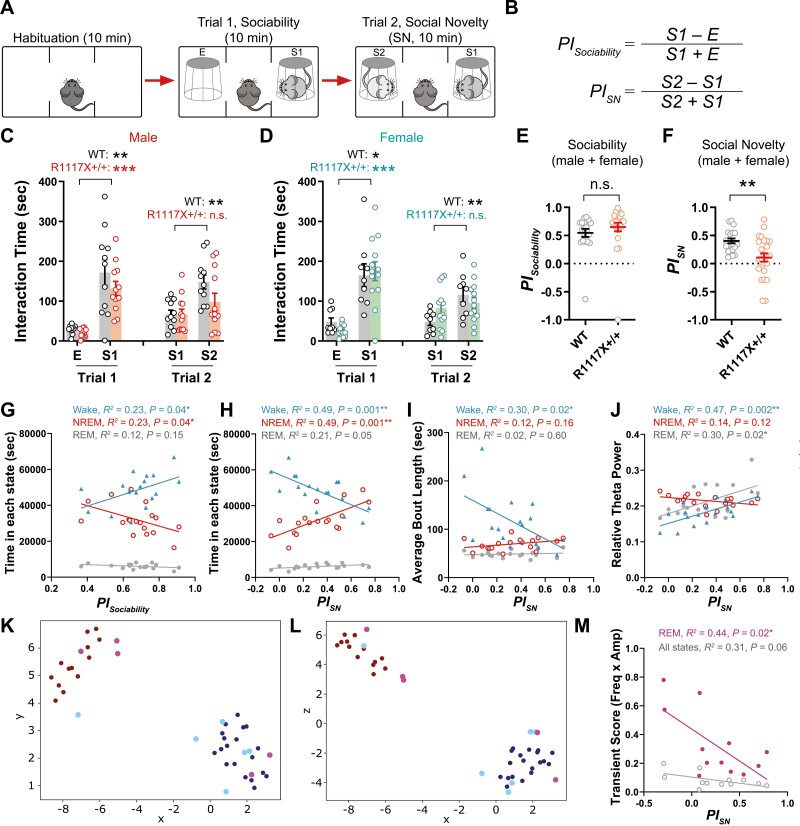
Figure 5.
Adolescent sleep and dopamine activity correlate with adult social preferences. (A) Schematics of the three-chamber social interaction test. (B) Preference indices of sociability (PISociability) and social novelty (PISN) were calculated as indicated. (C, D) The three-chamber test was performed at P56 using stimulus mice of same sex, similar age and from the same background, and total interaction time with each stimulus quantified and shown for the male (C, n = 11 in WT; 12 in R1117X+/+) and female (D, n = 9 in WT; 13 in R1117X+/+) test mice. RM two-way ANOVA, (C) Stimulus × Genotype F (3, 63) = 1.48, p = 0.23, Tukey’s post-tests, WT, both trials, ** p = 0.004; R1117X+/+, Trial 1, *** p = 0.0003, Trial 2, p = 0.38, (D) Stimulus × Genotype F (3, 60) = 2.01, p = 0.12, Tukey’s post-tests, WT, Trial 1, * p = 0.01, Trial 2, ** p = 0.002; R1117X+/+, Trial 1, *** p = 0.0002, Trial 2, p = 0.83. (E) Preference indices of sociability combined from both male and female mice. Welch’s t-test, t = 0.98, df = 42.95, p = 0.33. (F) Preference indices of social novelty combined from both male and female mice. Welch’s t-test, t = 3.46, df = 37.93, ** p = 0.001. (G) Linear regression between PISociability in adult three-chamber test and total time in wake, NREM and REM states quantified from adolescent sleep data (n = 18). (H–J) Linear regression between PISN in adulthood and total time (H), average bout length (I), or EEG theta power (J) of each state during adolescence (n = 18). (K, L) The 2D projections (K, xy; L, xz) of UMAP showing clustering of data points based on PISN. Red and blue points are training data representing animals with PISN greater and smaller than 0.2, respectively. Magenta and Cyan points are testing data representing animals with PISN greater and smaller than 0.2, respectively. (M) Linear regression between PISN in adulthood and the transient score of DA2m signals in REM or all states during adolescence (n = 12). For (C–F), data are shown as mean ± s.e.m. n.s., not significant. All tests were two-sided.

