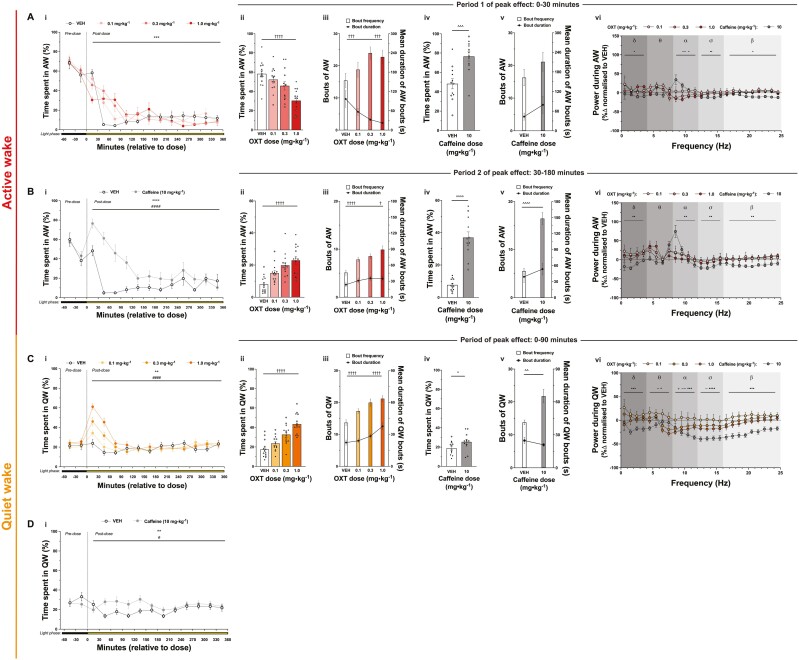
Figure 2.
Effects of i.p. oxytocin and i.p. caffeine on wake outcomes. Oxytocin effects. Influence of i.p. oxytocin (0, 0.1, 0.3, and 1 mg·kg−1) on %AW across entire 7-hour recording session (Ai), %AW during first period of peak effect (0–30 minutes) (Aii), AW bout frequency and mean AW bout duration during first period of peak effect (0–30 minutes) (Aiii), %AW during second period of peak effect (30–180 minutes) (Bii), AW bout frequency and mean AW bout duration during second period of peak effect (30–180 minutes) (Biii), %QW across entire 7-hour recording session (Ci), %QW during first period of peak effect (0–90 minutes) (Cii), and QW bout frequency and mean QW bout duration during first period of peak effect (0–90 minutes) (Ciii). Caffeine effects. Influence of i.p. caffeine (0 and 10 mg·kg−1) on %AW across entire 7-hour recording session (Bi), %AW during first period of peak effect (0–30 minutes) (Aiv), AW bout frequency and mean AW bout duration during first period of peak effect (0–30 min) (Av), %AW during second period of peak effect (30–180 minutes) (Biv), AW bout frequency and mean AW bout duration during second period of peak effect (30–180 minutes) (Bv), %QW across entire 7-hour recording session (Di), %QW during period of peak effect (0–90 minutes) (Civ), and QW bout frequency and mean QW bout duration during period of peak effect (0–90 minutes) (Cv). PSD effects. Influence of i.p. oxytocin and caffeine on ECoG PSD from 0 to 30 minutes (Avi) and 30–180 minutes (Bvi) during AW, and from 0 to 90 minutes during QW (Cvi). Sample sizes for oxytocin dose–response are n = 6 males (for all doses) and n = 8 females for all doses except 0.1 mg·kg−1 which is n = 7. Sample sizes for caffeine-positive control are n = 6 males and n = 6 females for all doses. Data represent mean values ± S.E.M., individual data points represent individual subject data (open circles—males; closed circles—females). For % time spent in sleep–wake state graphs, data points represent values for 30-minute bins; values pertain to the bin of time defined by the x-axis timepoints to the immediate left and right of the data point. Dose was administered at ZT0 and color of bar below x-axis signifies light cycle phase at each time point: black—dark (active) phase; yellow—light (rest) phase. For ECoG PSD figures, data represent mean percentage change in ECoG PSD (0.1–25 Hz) ± S.E.M. Statistical significance is indicated by the following symbols: * – dose main effect; # – dose × time interaction effect; † – linear trend contrast; ^ pairwise comparison; × – 0.1 mg·kg−1 oxytocin versus VEH; + – 0.3 mg·kg−1 oxytocin versus VEH; ~ – 1 mg·kg−1 oxytocin versus VEH; • – 10 mg·kg−1 caffeine versus VEH. For graphs with two y-axes, the alignment of the significance symbol represents which outcome the significance refers to: left—bout frequency; right—mean bout duration. Level of statistical significance is indicated by the number of symbols: one—p < .05, two—p < .01, three—p < .001, four—p < .0001.

