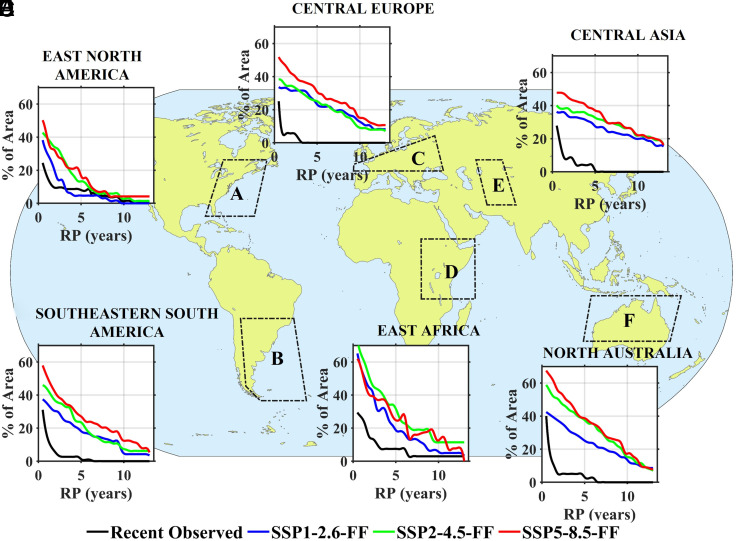
Fig. 3.
Spatial Evolution of High-End Risk of CDHW under Climate Change: (A–F) Area–frequency curves for (A) East North America, (B) Southeastern South America, (C) Central Europe, (D) East Africa, (E) Central Asia, and (F) North Australia are shown recent observed period (1982 to 2019) and for the model simulated far future (2058 to 2095) based on the three future climate scenarios. The curves are smoothened using a 7-y moving mean.

