Fig. 2.

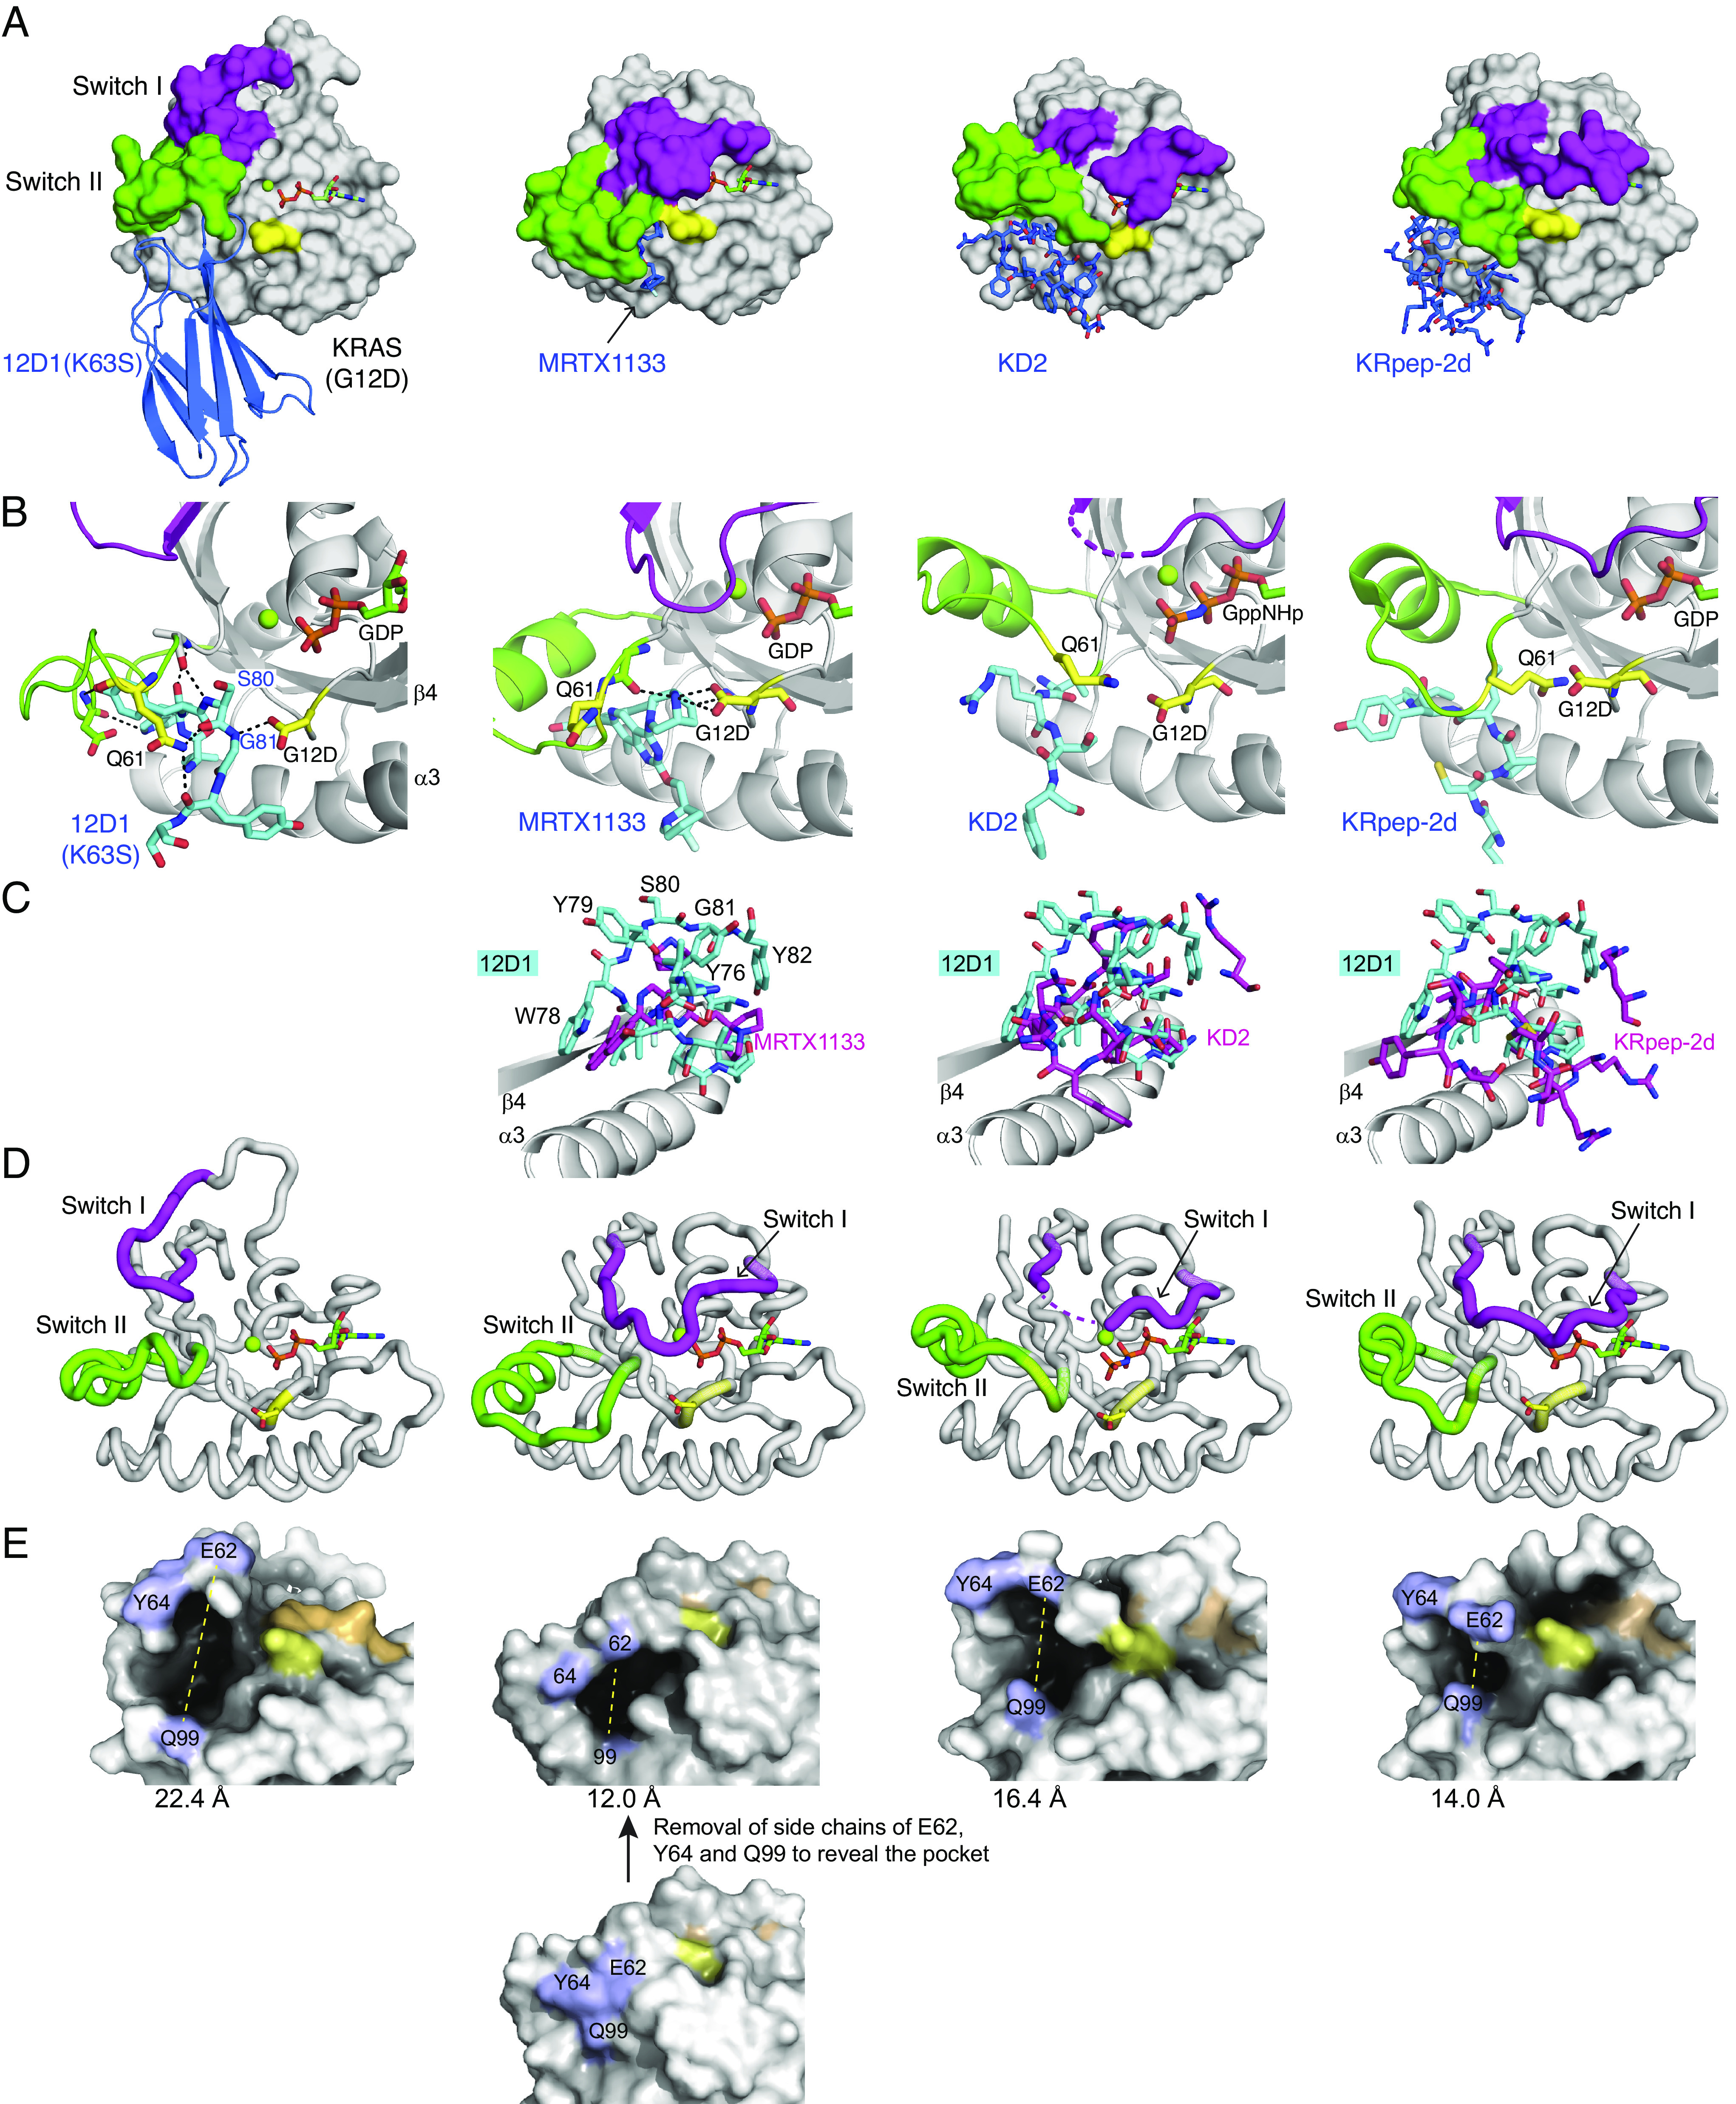
The crystal structure of 12D1(K63S) in complex with KRAS(G12D)•GDP, and comparisons with the structures of other KRAS(G12D) inhibitors. (A) Comparison of 12D1(K63S)–KRAS(G12D)•GDP with MRTX1133–KRAS(G12D)•GDP (PBD: 7RPZ), KD2–KRAS(G12D)•GppNHp (PDB: 6WGN), and KRpep-2d–KRAS(G12D)•GDP (PDB: 5XCO). 12D1(K63S) and other inhibitors are depicted in blue. The switch I and switch II regions and the G12D residue are shown in magenta, green, and yellow, respectively. MRTX1133 is only marginally visible in this mode of presentation. (B) Close-up views of the G12D and Q61 residues (yellow) and surrounding residues of inhibitors (cyan) in the four structures. The hydrogen bonds are indicated as dashed lines. 12D1(K63S) directly interacts with the side chain of the G12D mutation, which resembles interaction between MRTX1133 and the G12D mutation. (C) The superpositions of other inhibitors (magenta) on 12D1 residues (cyan) in the S-II pocket. The structures were superimposed using residues 76–162 of KRAS as the reference. The β4 and α3 regions of KRAS are shown to orient the reader. (D) A comparison of the backbone conformations of the switch I (magenta) and switch II (green) regions of KRAS in the four structures. The inhibitors are not shown for clarity. (E) A comparison of the S-II pocket in the four structures. E62RAS, Y64RAS, and Q99RAS resides are shown in light blue, the nucleotides are shown in orange, and Asp12 in yellow. The distance between E62RAS and Q99RAS (yellow dotted line) is indicated under each structure. For MRTX1133–KRAS(G12D)•GDP, the side chains of E62RAS, Y64RAS, and Q99RAS are removed in order to expose the pocket.
