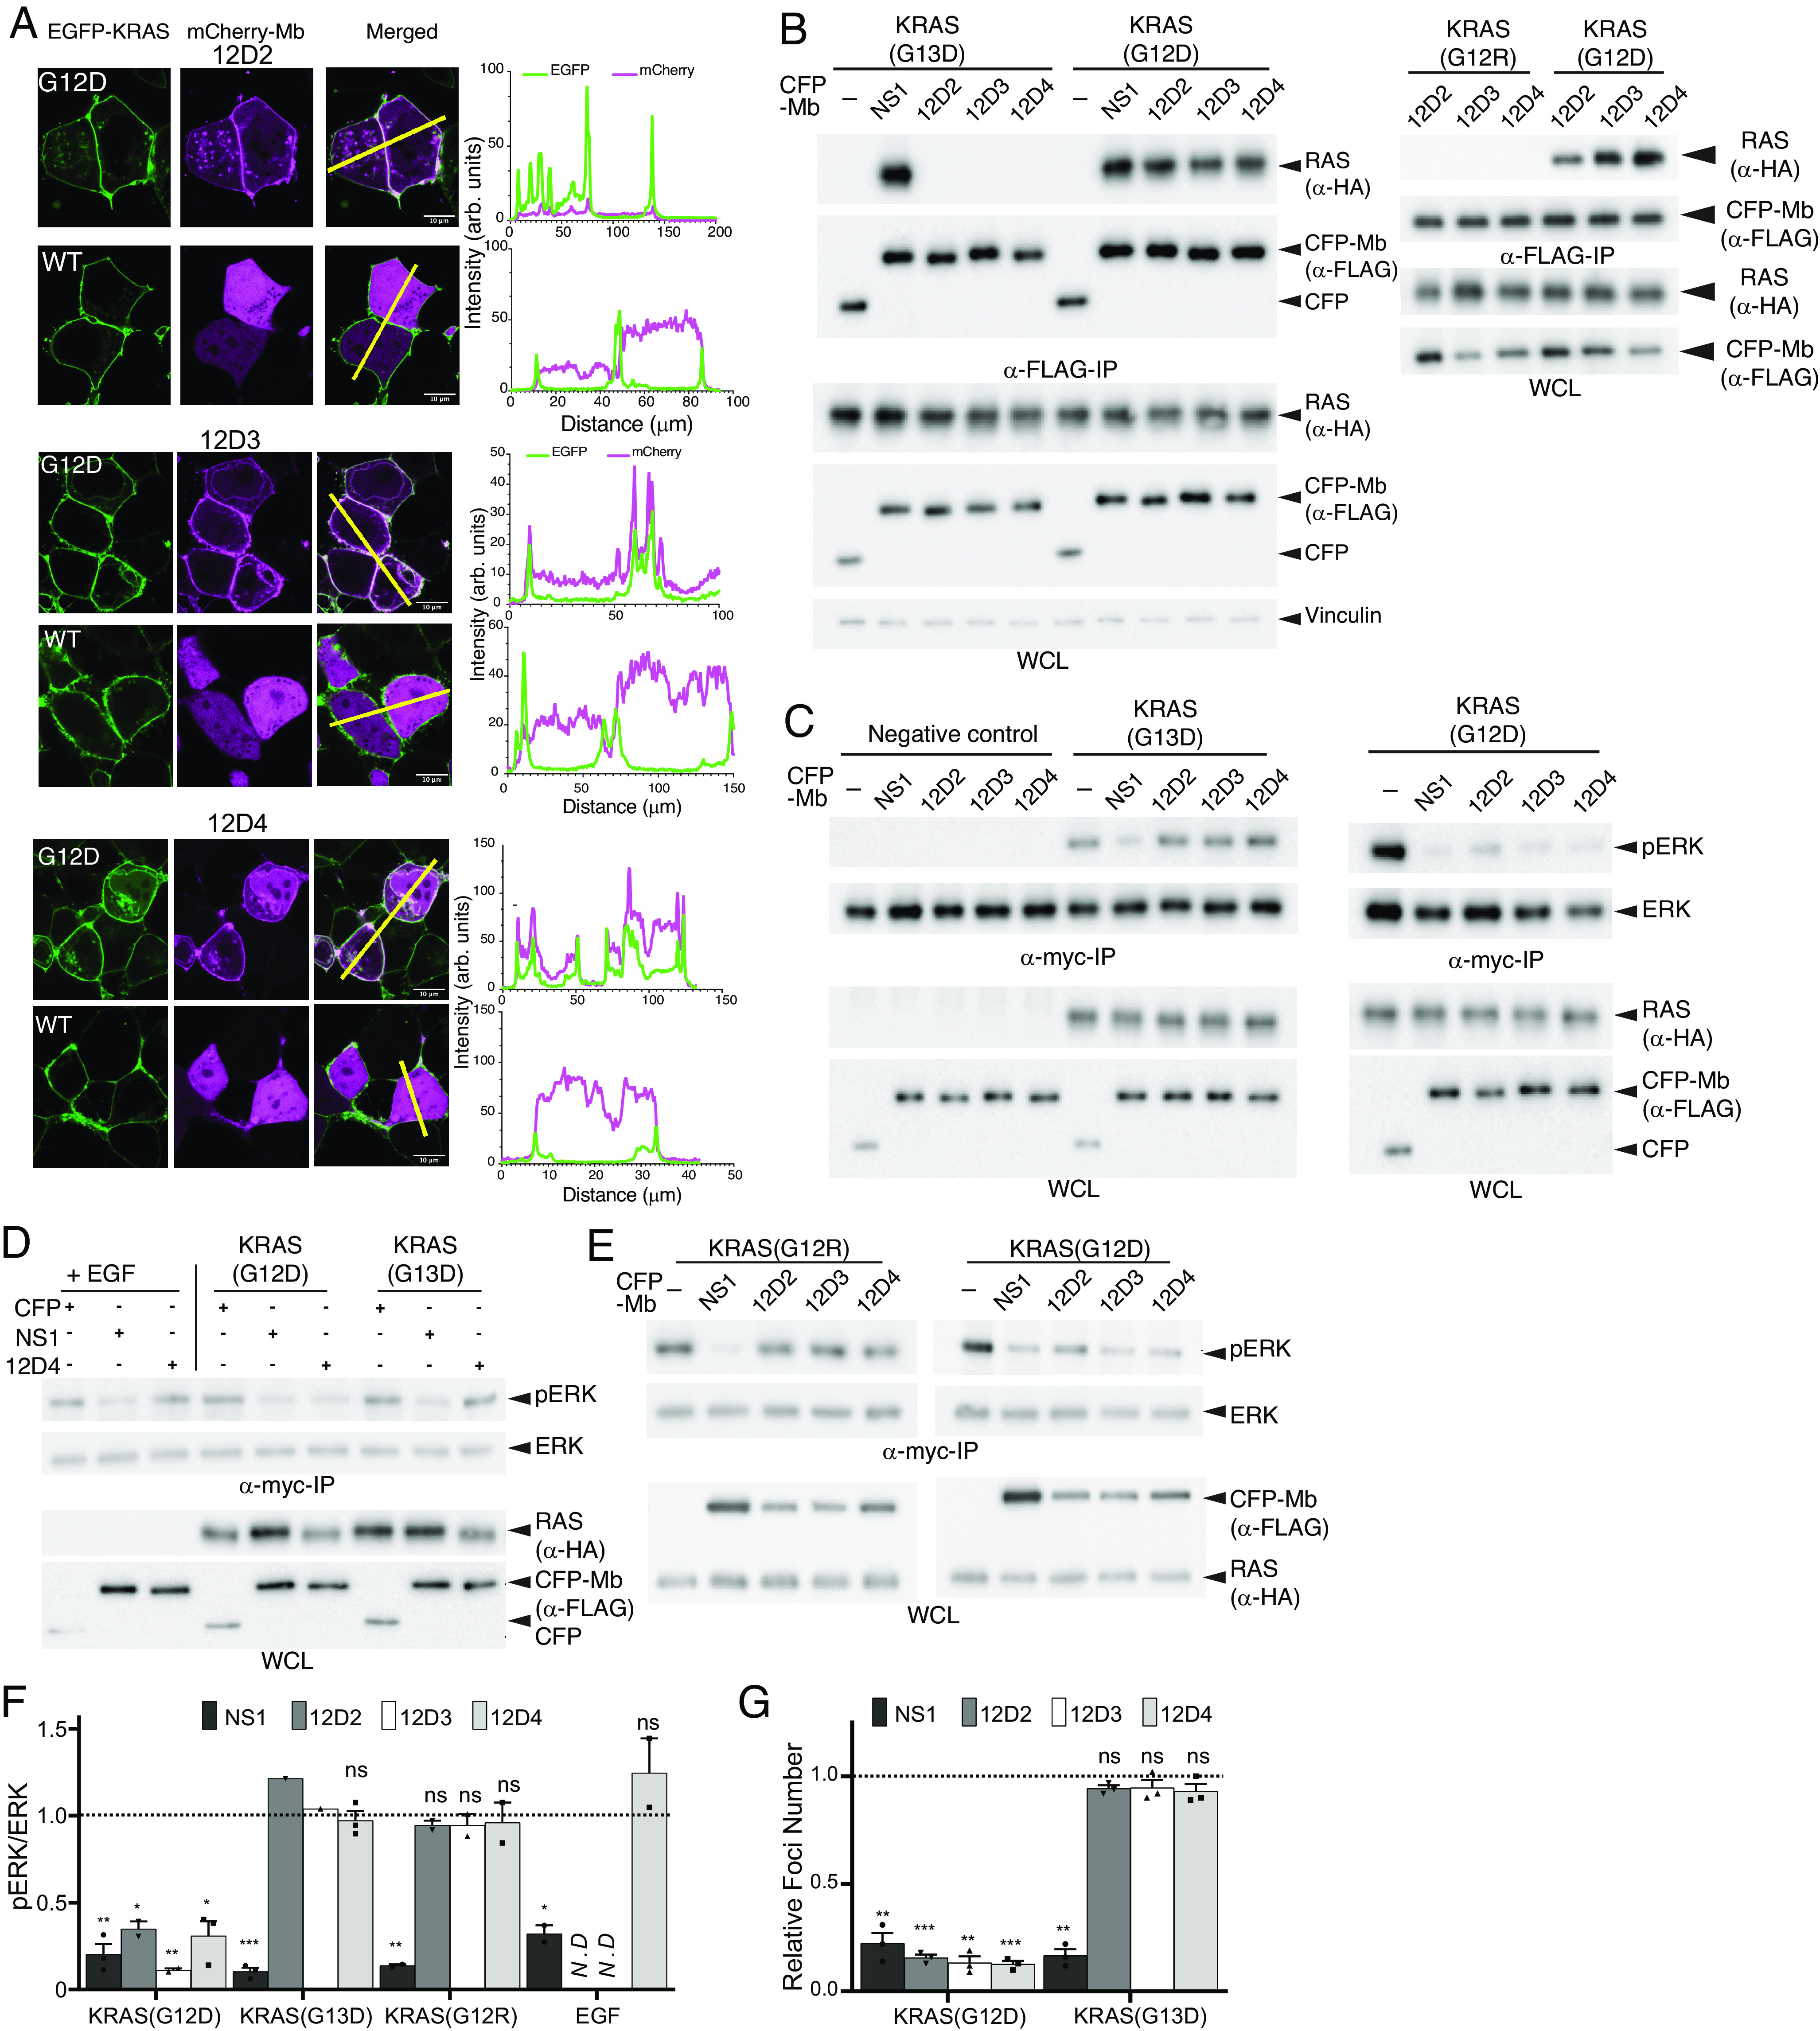
Fig. 6.

Selective engagement and inhibition of KRAS(G12D) by monobodies. (A) Colocalization of mCherry-fused 12D2, 12D3, and 12D4 (pseudo-color magenta) with overexpressed EGFP-fused KRAS(G12D) and KRAS(WT) (pseudo-color green) in HEK293T cells. The scale bar denotes 10 μm. The graphs on the right show the fluorescence intensity profiles under the yellow lines in the microscopy images. (B) Coimmunoprecipitation of HA-tagged KRAS mutants and FLAG- and CFP-tagged monobodies. The proteins were coexpressed in HEK-293 cells and the capture of KRAS proteins was probed. The NS1 monobody, which is agnostic to KRAS mutations, was used as a control. (C–E) Effects of monobodies on ERK–MAPK activation mediated by KRAS mutants and by EGF stimulation. CFP-tagged monobodies and MYC-tagged ERK were coexpressed in HEK293 cells, and phosphorylation of MYC-tagged ERK was detected following MYC IP and western blotting. CFP and CFP-NS1 were used as controls. The negative control lanes in C show results with cells without the expression of a KRAS mutant. (F) Quantification of pERK levels for data in panels C–E. The pERK level was first normalized to the total ERK level. The resulting value in the presence of the indicated monobody was divided by the value for CFP alone. The dotted line at 1 represents the normalized pERK level by CFP alone without inhibition. The P values were determined using a Student’s t test between CFP-monobody and CFP for each condition. (G) Inhibition of KRAS(G12D)-mediated transformation of NIH/3T3 cells with monobodies, as measured by quantification of foci numbers. The raw data are provided in SI Appendix, Fig. S7A. Each bar represents the ratio of foci number with CFP-monobody to that with CFP alone (n = 3; mean ± SD). The P values were determined using a Student’s t test between CFP-monobody and CFP for each condition. *P ≤ 0.05; **P ≤ 0.01; and ***P ≤ 0.001.
