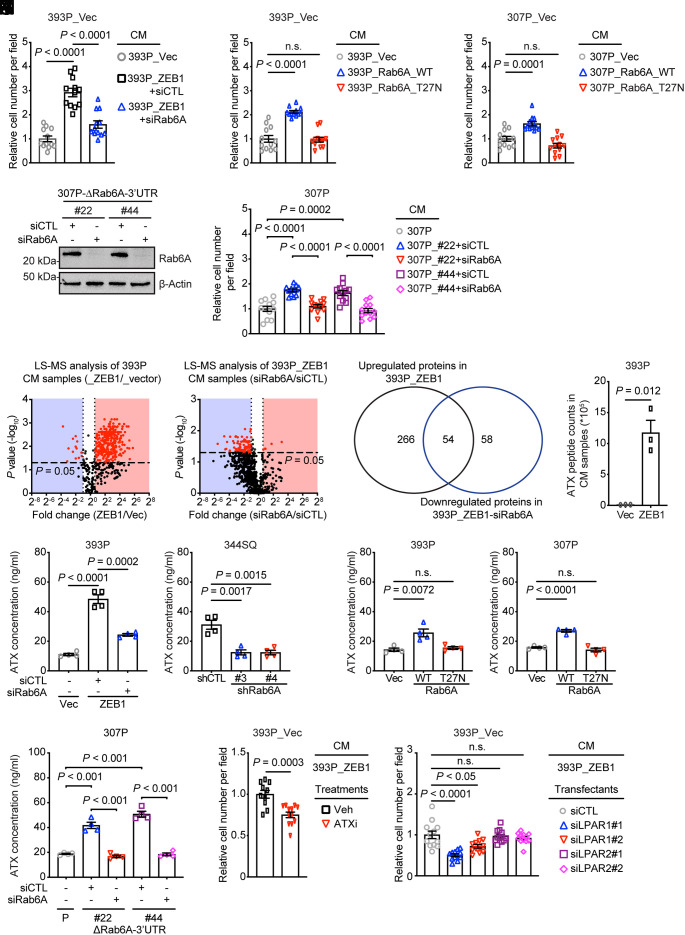
Fig. 3.
ZEB1 activates a proinvasive autocrine loop. (A–C) Quantification of cells that invaded through Matrigel-coated filters in Boyden chambers. Upper chambers loaded with indicated CM samples. Wild-type (WT) or enzymatically dead mutant (T27N) Rab6A. Replicates (12 fields from four replicates) were averaged (bar graph). (D) WB analysis of Rab6A levels in siRNA-transfected 307P cells. CRISPR/Cas-9 mutagenesis carried out to generate a deletion in the miR-148a-binding site in the Rab6A 3′-UTR (ΔRab6A-3′-UTR). (E) Quantification of invasive cells in Matrigel-coated Boyden chambers. Upper chambers contained CM from the indicated cells. Replicates (12 fields from four replicates) were averaged (bar graph). P values were determined using two-tailed Student’s t-test. (F) Volcano plot of proteins identified by LC–MS analysis of CM samples. P values (y axis) and fold-change (x axis). Proteins at significantly different concentrations (red dots, P < 0.05) in 393P_ZEB1 cells and 393P_vector cells (left plot) and in Rab6A-deficient and replete 393P_ZEB1 cells (right plot). (G) Venn diagram illustration of differentially expressed proteins identified in F. (H) ATX peptide counts by LC–MS analysis. (I–L) ELISA of ATX concentrations in CM samples (n = 4 replicates per sample) from KP cells subjected to ectopic ZEB1 expression (I), Rab6A depletion (J), ectopic expression of wild-type (WT) or enzyme-dead mutant (T27N) Rab6A (K), or deletion of the miR-148a binding site in the Rab6A 3′-UTR (ΔRab6A-3′UTR) (L). Parental (P) and mutant clones (#22, #44) (L). (M) Quantification of invasive cells in Matrigel-coated Boyden chambers. Upper chambers contained 393P_ZEB1 cell-derived CM and vehicle or ATX inhibitor (ATXi). (N) Quantification of invasive cells in Matrigel-coated Boyden chambers. Cells were transfected with distinct siRNAs (#1 or #2) against LPAR1 or LPAR2. Upper chambers loaded with CM from 393P_ZEB1 cells. P values were determined using two-tailed Student’s t-test.

