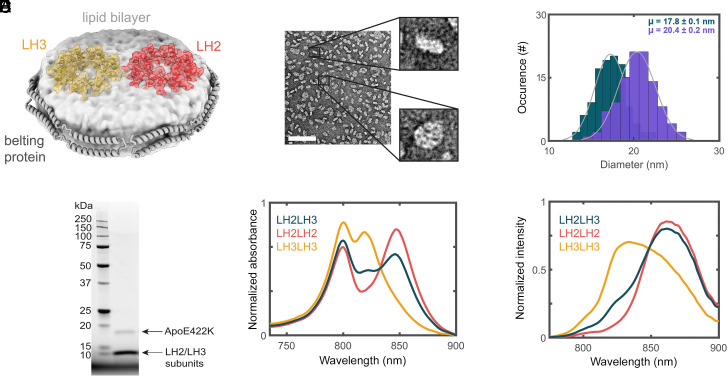
Fig. 1.
Successful production of LH2–LH3 DLDs. (A) Schematic of LH2 (red) and LH3 (orange) embedded in a nanodisc. The discoidal lipid bilayer (light gray) is encircled by the ApoE422K belting protein (gray ribbons). (B) nsTEM image of nanodiscs. The scale bar (white line) is 100 nm. (C) Histogram of nanodisc diameters for small (teal, 17.8 ± 0.1 nm) and large (purple, 20.4 ± 0.2 nm) DLDs. (D) SDS-PAGE of the LH2–LH3 DLDs showing the presence of belting protein along with LH2 and LH3 subunits. (E) Linear absorption and (F) fluorescence spectra of LH2–LH2 DLDs (red), LH3–LH3 DLDs (orange), and LH2–LH3 DLDs (teal). All spectra are normalized by area. The excitation wavelength for the fluorescence data is 532 nm.

