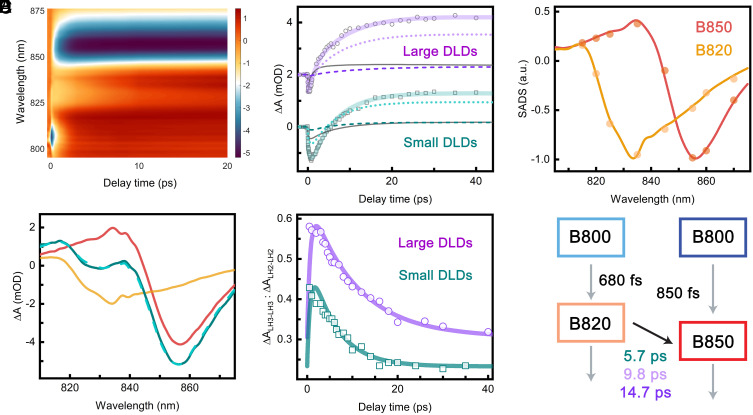
Fig. 3.
LH3-to-LH2 energy transfer dynamics. (A) 2D representation of TA spectra of small LH2–LH3 DLDs. The color bar describes signal intensity (ΔmOD). (B) Absorption transients of small (teal) and large (purple) LH2–LH3 DLDs at 840 nm. Experimental values are shown as open symbols, and the fitted kinetics are shown as solid lines. The large DLDs transient was deconvoluted into antiparallel (light purple dotted line) and parallel (purple dashed line) LH2–LH3 and combined LH2–LH2 and LH3–LH3 (dark gray line) contributions. The transient of small DLDs was deconvoluted into antiparallel (turquoise dotted line) and parallel (dark cyan dashed line) LH2–LH3 and combined LH2–LH2 and LH3–LH3 (dark gray line) contributions. The large DLDs transient is offset by 2 mOD. (C) Normalized SADS of B820 (orange) and B850 (red) components from the TA data of small LH3–LH3 DLDs and LH2–LH2 DLDs, respectively. Results are shown from both simultaneous fitting of the single-wavelength kinetics (dots) and global analysis (lines). (D) Transient absorption spectra of small LH2–LH3 DLDs (teal), LH3–LH3 DLDs (orange), and LH2–LH2 DLDs (red) at 5-ps time delay. The turquoise dashed line is the LH2–LH3 DLDs spectrum constructed from the linear combination of the spectra from LH3 and LH2 DLDs. (E) The population dynamics of excited B820 from the model fitting (solid lines) and the results of fitting the TA spectra (open symbols). The relative contributions of the LH3–LH3 and LH2–LH2 DLDs spectra to the small (teal) and large (purple) LH2–LH3 DLDs spectra are plotted as a function of time. The correspondence between the two indicates that the fitting successfully extracted the kinetics of LH3-to-LH2 energy transfer. (F) Schematic of the model used to fit the LH2–LH3 DLDs with corresponding timescales. The values held fixed from LH2–LH2 DLDs and LH3–LH3 DLDs are shown as gray arrows, and the extracted LH3-to-LH2 energy transfer timescale is shown as a black arrow.

