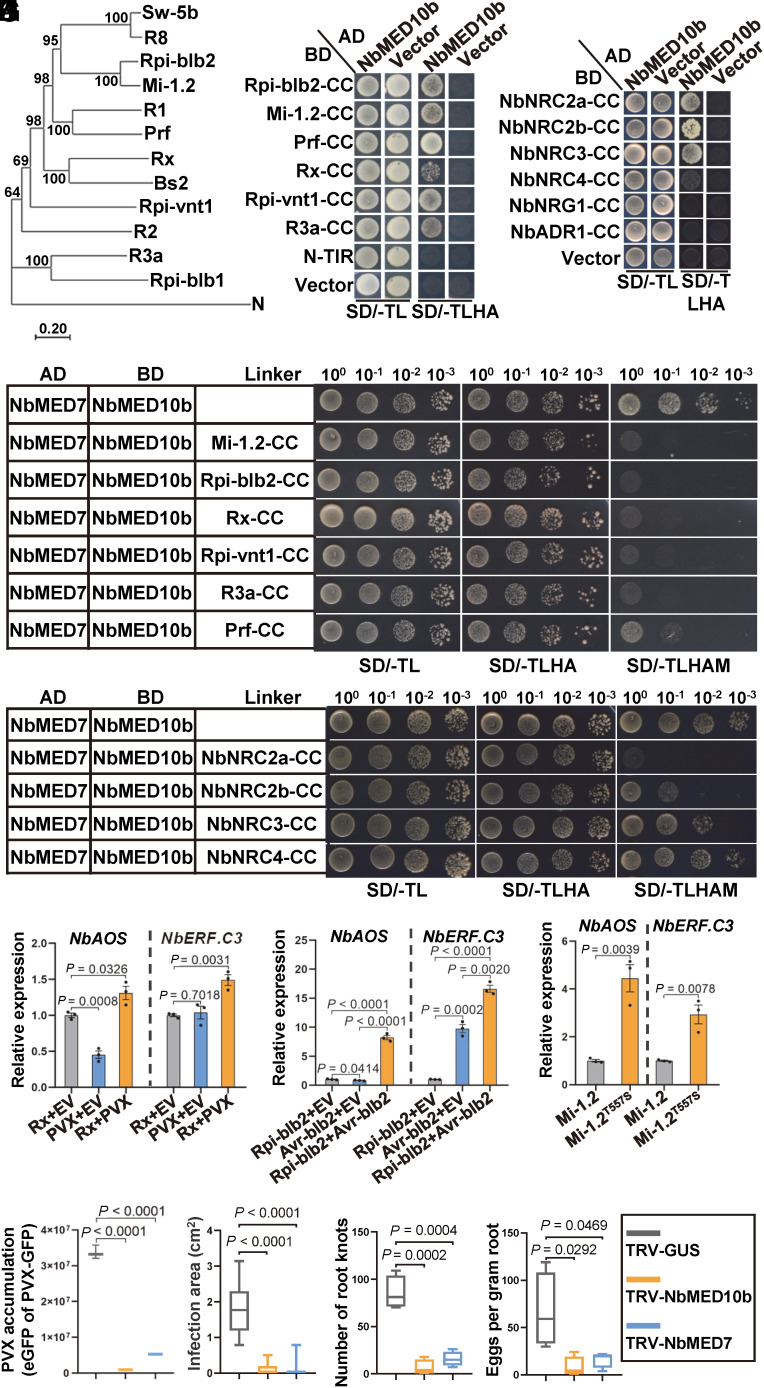
Fig. 6.
CC domain of CNLs in Solanaceae modulates MED10b/MED7 interaction to activate jasmonate-dependent immune pathway. (A) A phylogenetic tree constructed using CNLs from various solanaceous species. Sequences of these NLRs were retrieved from the GenBank, and the phylogenetic tree was conducted using the neighbor-joining method in the MEGA7 package. (B) Y2H assay results showing the interactions between NbMED10b and various CC domains of CNLs from different solanaceous species. The transformed yeast cells were grown on the SD/-TL and the SD/-TLHA plates, respectively. (C) Y2H assay results showing the interactions between NbMED10b and the CC domains in the helper NLRs NRC2/3/4. The transformed yeast cells were grown on the SD/-TL and the SD/-TLHA plates, respectively. (D) Y3H assay results showing the effects of CC domains from different CC-type NLRs on the interaction between NbMED10b and NbMED7. Yeast cells coexpressing AD-NbMED7, BD-NbMED10b, Mi-1.2-CC, Rip-blb2-CC, Rx-CC, Rpi-vnt1-CC, R3a-CC, or Prf-CC were grown, respectively, on the SD/-TL, SD/-TLHA, or SD/-TLHAM medium plates to determine the interaction between NbMED7 and NbMED10b. (E) Y3H assay results showing the effects of the CC domains of NRC2a, NRC2b, NRC3, and NRC4 on the interaction between NbMED10b and NbMED7. Yeast cells coexpressing AD-NbMED7, BD-NbMED10b, Vector, NbNRC2a-CC, NbNRC2b-CC, NbNRC3-CC, or NbNRC4-CC were grown on the SD/-TL, SD/-TLHA, or SD/-TLHAM medium plates to determine the interaction between NbMED7 and NbMED10b. (F) Quantitative RT-PCR analysis results showing the expressions of representative marker genes involved in the JA signaling pathways in N. benthamiana coexpressing Rx with EV, PVX with EV, or Rx with PVX. The expression levels of NbActin in these samples were used as the internal controls. Data are presented as the means ± SE (three independent biological samples per treatment). (G) Quantitative RT-PCR analysis results showing the expression of representative marker genes involved in the JA signaling pathways in N. benthamiana coexpressing Rpi-blb2 with EV, Avr-blb2 with EV, or Rpi-blb2 with Avr-blb2. The expression levels of NbActin in these samples were used as the internal controls. Data are presented as the means ± SE (three independent biological samples per treatment). (H) Quantitative RT-PCR analysis results showing the expressions of representative marker genes involved in the JA signaling pathways in N. benthamiana expression of Mi-1.2 or Mi-1.2T557S. The expression levels of NbActin in these samples were used as the internal controls. Data are presented as the means ± SE (three independent biological samples per treatment). (I) The accumulation level of eGFP expressing from PVX in NbMED10b-silenced, NbMED7-silenced, or nonsilenced control (TRV-GUS) leaves of N. benthamiana in the infiltrated leaves was measured and quantified using the Image J software. Statistical analyses were done using the two-tailed Student’s t test. Data are presented as the means ± SE (three biological samples per treatment). (J) The size of P. infestans lesions in NbMED10b-silenced, NbMED7-silenced, or nonsilenced control leaves of N. benthamiana was measured and quantified using the Image J software. Statistical analyses were done using the two-tailed Student’s t test. Data are presented as the means ± SE (10 biological samples per treatment). (K) The numbers of root knots on NbMED10b-silenced, NbMED7-silenced, or nonsilenced control (TRV-GUS) roots of N. benthamiana plants and the statistical differences between the treatments were determined using the two-tailed Student’s t test. Data are presented as the means ± SE (four biological samples per treatment). (L) The numbers of nematode egg masses on the assayed plant roots. The statistical differences between the treatments were determined using the two-tailed Student’s t test. Data are presented as the means ± SE (four biological samples per treatment).

