
Fig. 1.
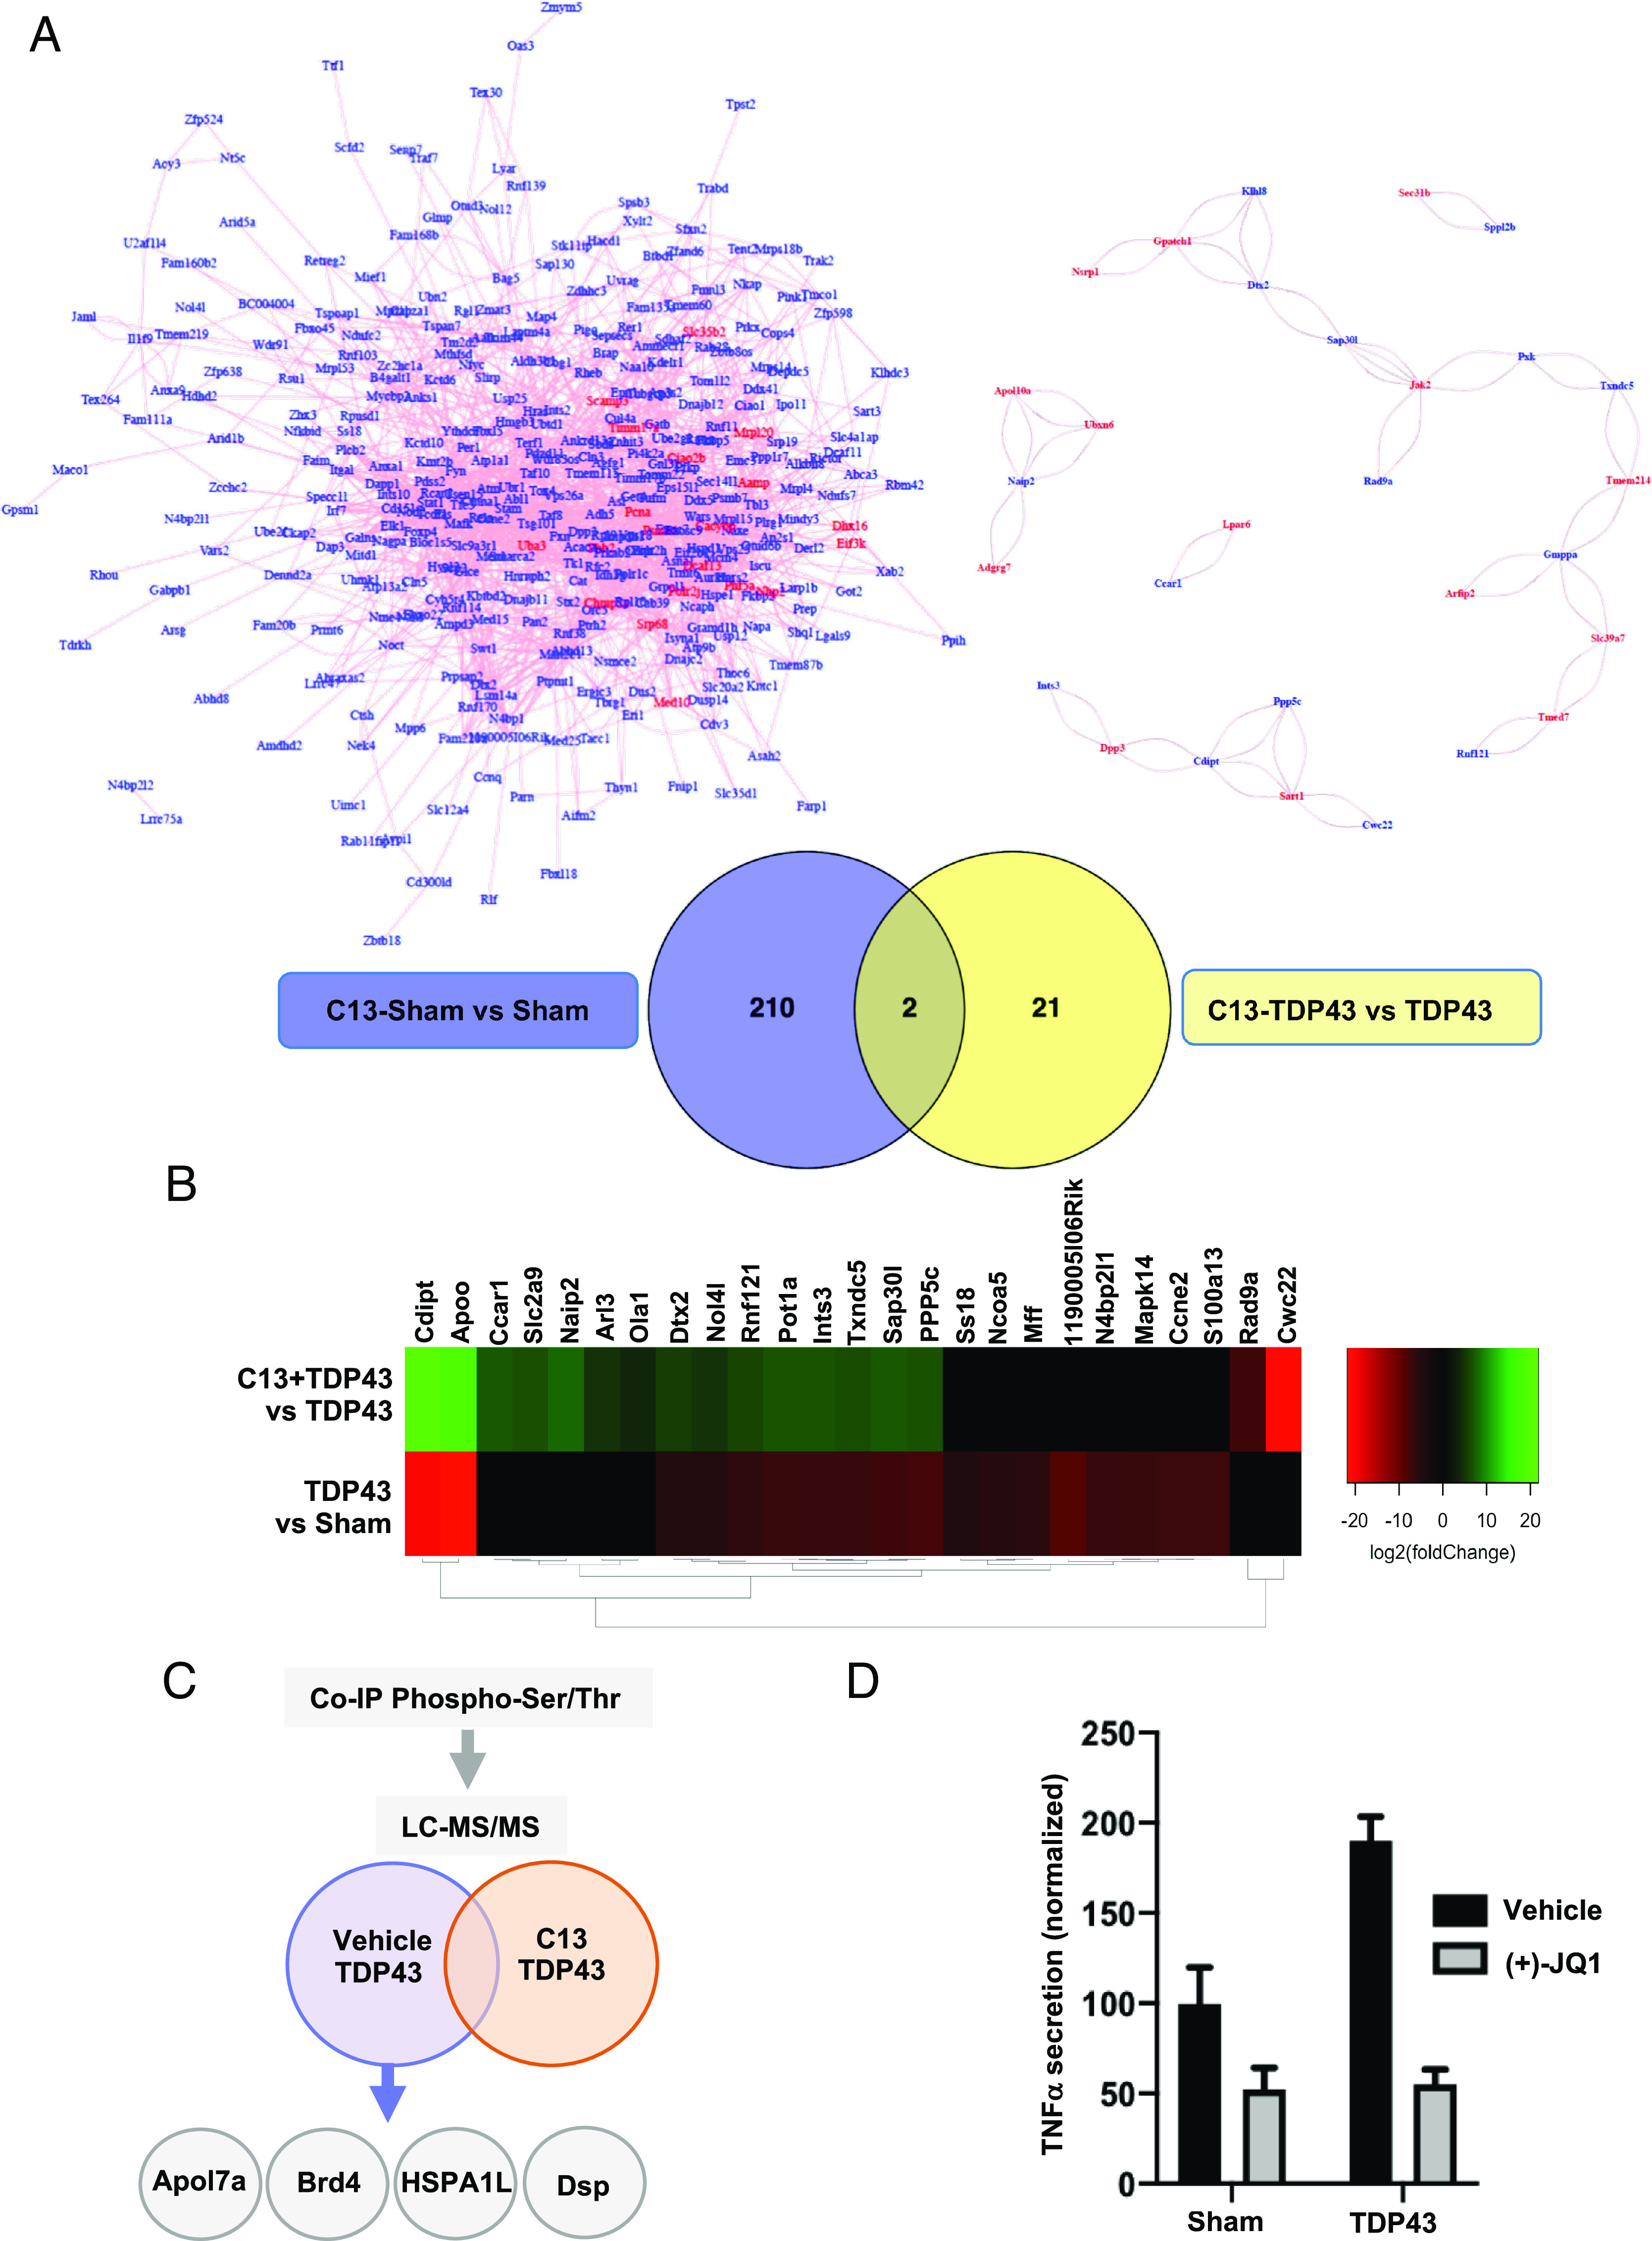
MOK-mediated mechanisms occur in microglial cells upon exposure to TDP-43 aggregates. (A, Bottom) Venn diagrams showing the number of DEGs from analyzed SLAM-Seq data obtained with SIM-A9 cells exposed to 5 µg/mL TDP-43 aggregates (TDP43) or sham aggregates (Sham) for 4 h, pretreated for 1 h with 10 µM C13 [or DMSO (dimethylsulfoxide) as vehicle]. Results are from three independent experiments (N = 3). Indicated are the number of DEGs for “C13 Sham vs. Sham” and “C13-TDP43 vs. TDP43” comparisons (PAdj. < 0.05 and PAdj. < 0.1, respectively). (A, Top) Predicted network analysis based on the two sets of identified DEGs by using GeneMANIA (19). Blue labels correspond to top DEGs and red labels, to inferred genes. (B) Heatmap representing the relative expression profiles (DEGs with PAdj. < 0.05) comparing “TDP43 vs. Sham” and “C13-TDP43 vs. TDP43” treatments. The differential regulation in gene expression changes between both comparisons indicates an effect of MOK inhibitor C13 in the transcriptional profile of microglial cells upon exposure to TDP-43 aggregates. (C) Schematic representation of LC–MS/MS analysis of eluates from antiphospho-Ser/Thr immunoprecipitation assays of lysates from primary microglial cells exposed to 5 µg/mL TDP-43 aggregates, pretreated for 1 h with 10 µM C13 (or DMSO). (D) Determination of TNFα by ELISA from primary microglial cells exposed to 5 µg/mL TDP-43 aggregates (TDP43) or sham aggregates (Sham) overnight, pretreated for 1 h with 10 µM (+)-JQ1 or DMSO (vehicle). Shown values were normalized to Sham control. Data are mean ± SD (N = 2).