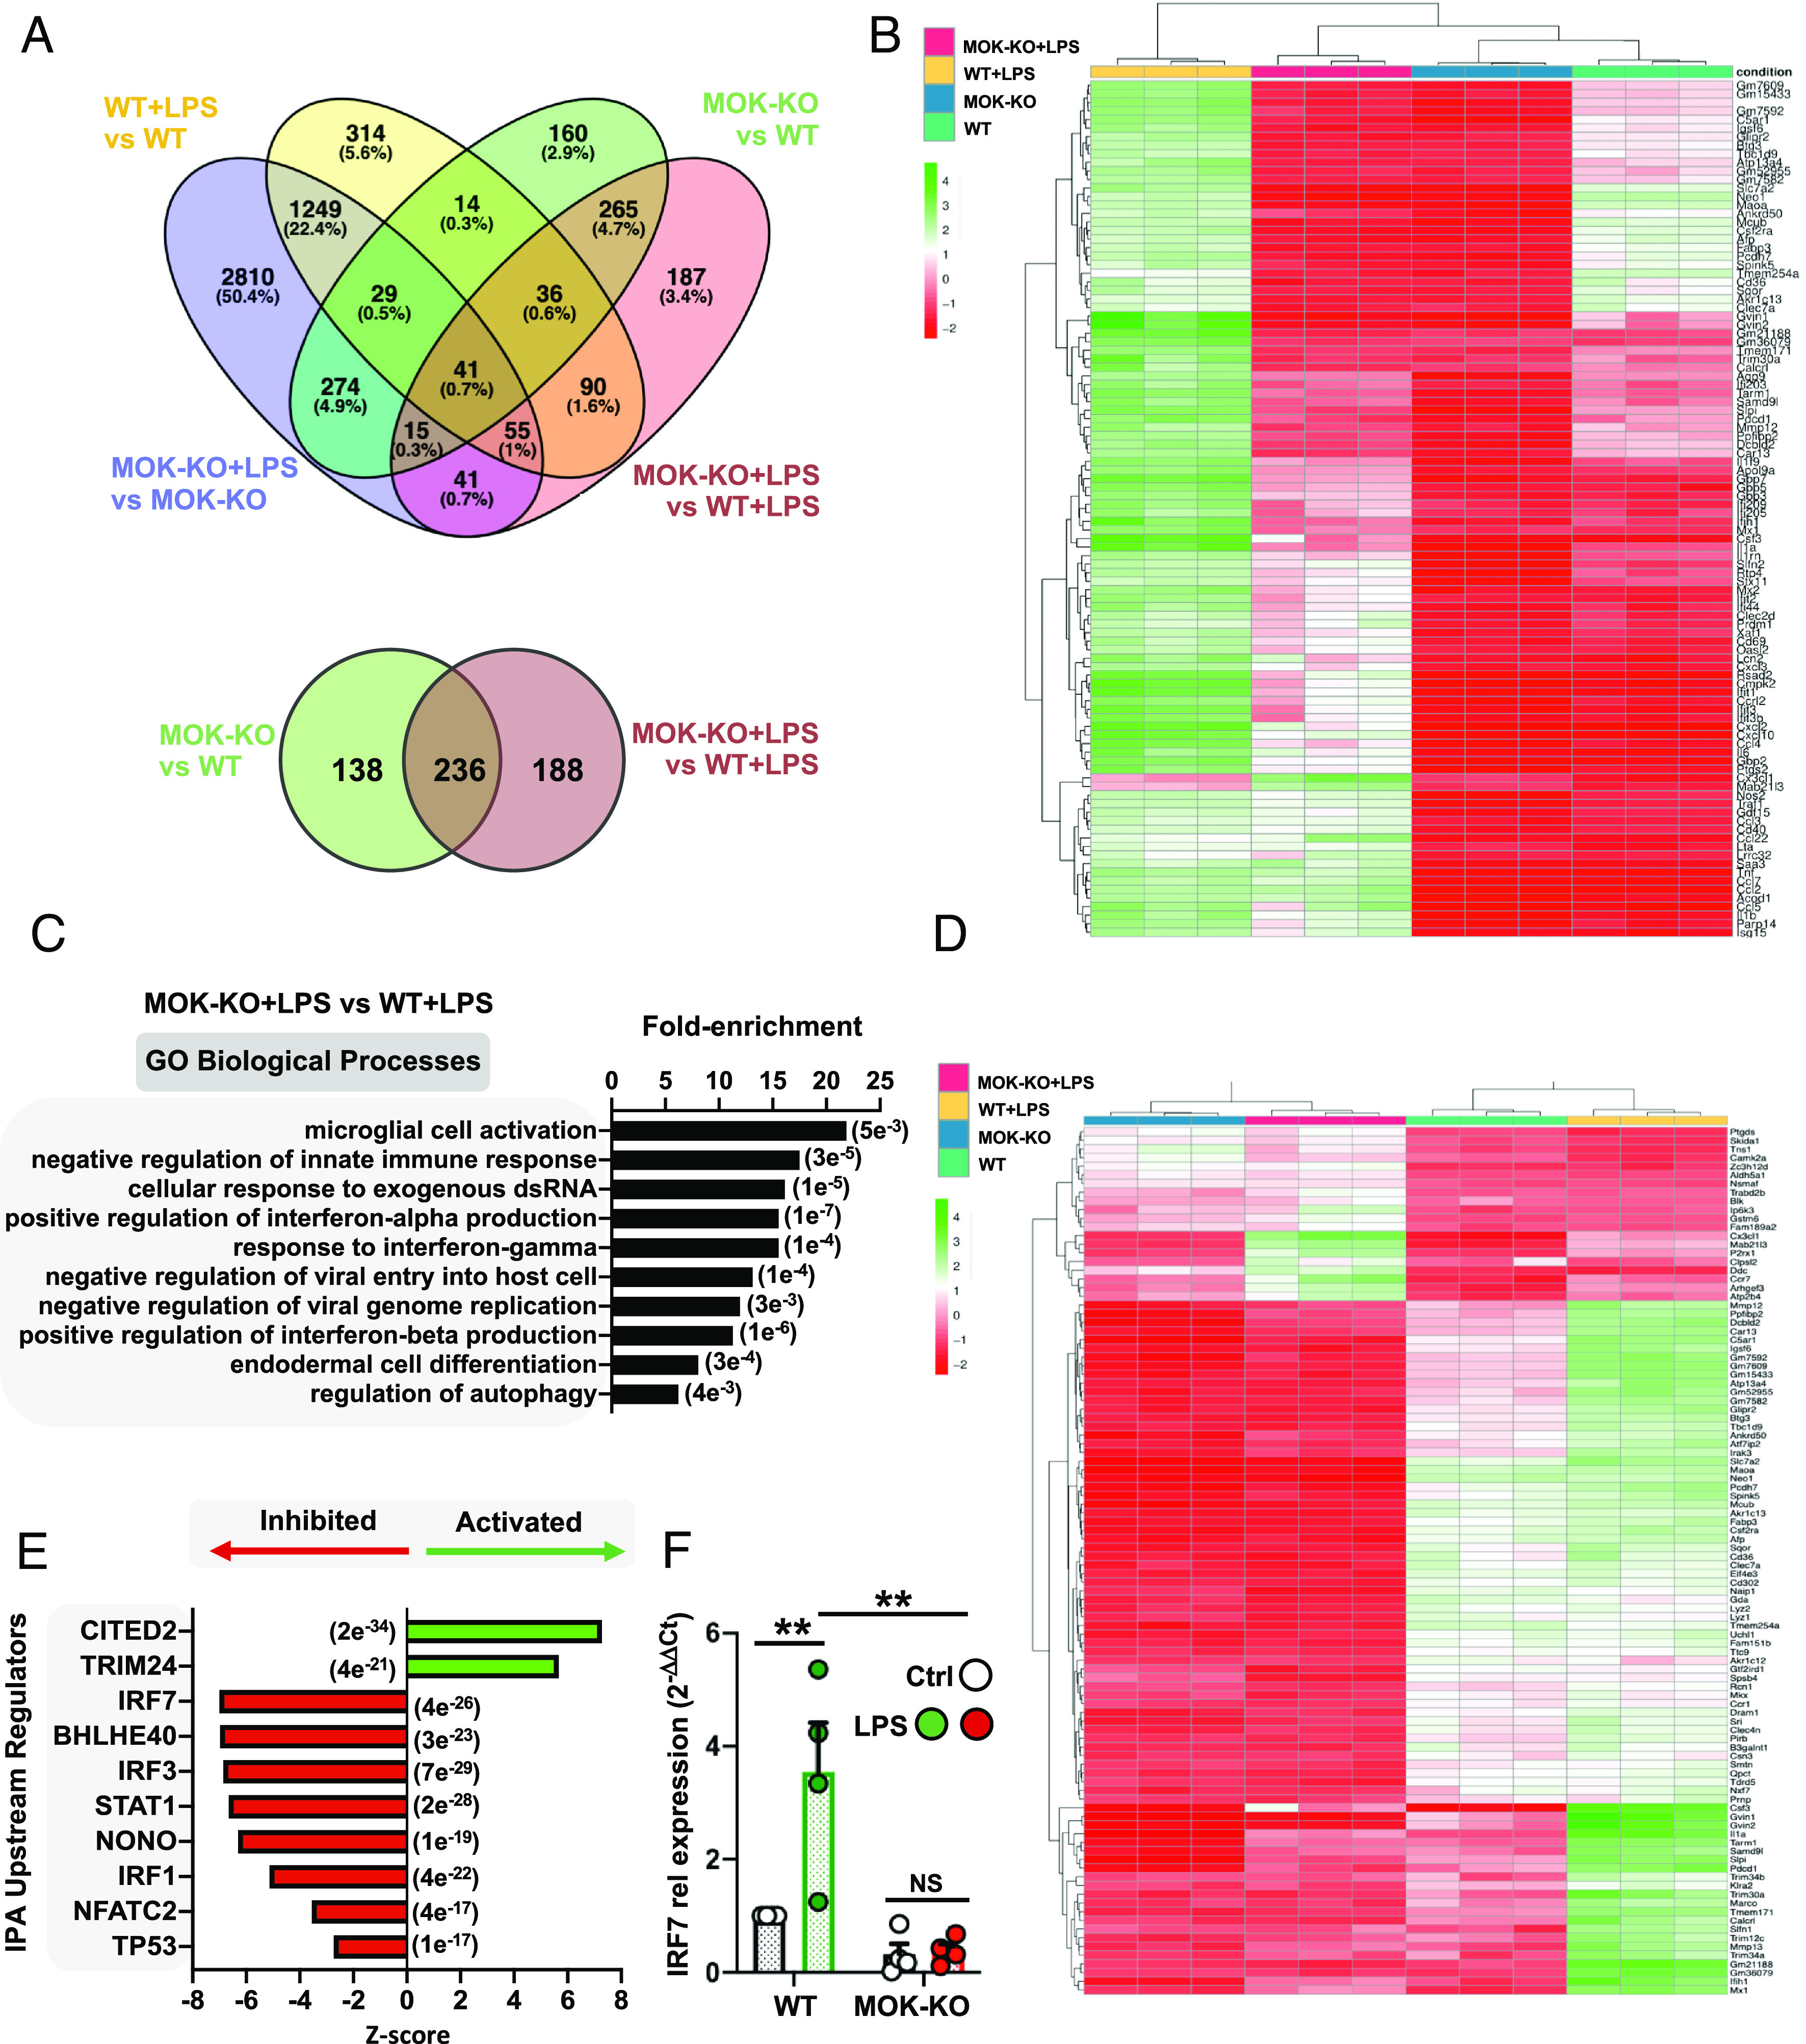
Fig. 3.

Transcriptomic analysis from RNA-Seq studies of MOK-KO cells and response to LPS stimulation. Data in A–E are from 3 independent experiments (N = 3). (A) Venn diagrams depicting the number of total (Top) and protein-coding (Bottom) DEGs between MOK-KO and WT SIM-A9 cells under basal conditions and/or after 1 µg/mL LPS stimulation for 5 h (PAdj. < 0.05; log2 fold change >2 and <−2); (B) Heatmap showing unsupervised clustering analysis for the top 100 protein-coding genes based on relative expression levels in the four samples; (C) GO “biological process” term enrichment analysis of total DEGs for MOK-KO+LPS vs. WT+LPS. Shown are the top hits based on the P-value (indicated in parentheses) with at least three up-/down-regulated genes; (D) Heatmap depicting clustering analysis for 100 coding DEGs identified for the MOK-KO+LPS vs. WT+LPS comparison (consisting of the top 80% down-regulated and top 20% up-regulated, genes to maintain proportionality of all significant DEGs found); (E) Top 10 IPA-predicted upstream expression regulators from coding DEGs comparing MOK-KO vs. WT cells upon LPS stimulation, indicating positive (activated) or negative (inhibited) z-scores. The results are from all genes that were found to be differentially regulated in the RNA-Seq deseq2 analysis in any comparison with PAdj of <e-5. The P value of overlap is indicated in parentheses; (F) Assessment of IRF7 gene expression by qRT-PCR from WT and MOK-KO SIM-A9 cells stimulated with 1 µg/mL LPS for 5 h. Data represent fold changes relative to unstimulated WT cells (WT Ctrl) (N = 4). One-way ANOVA followed by the Tukey post hoc test. Data are the mean ± SEM. from N independent experiments, and *P < 0.05 and **P < 0.01.
