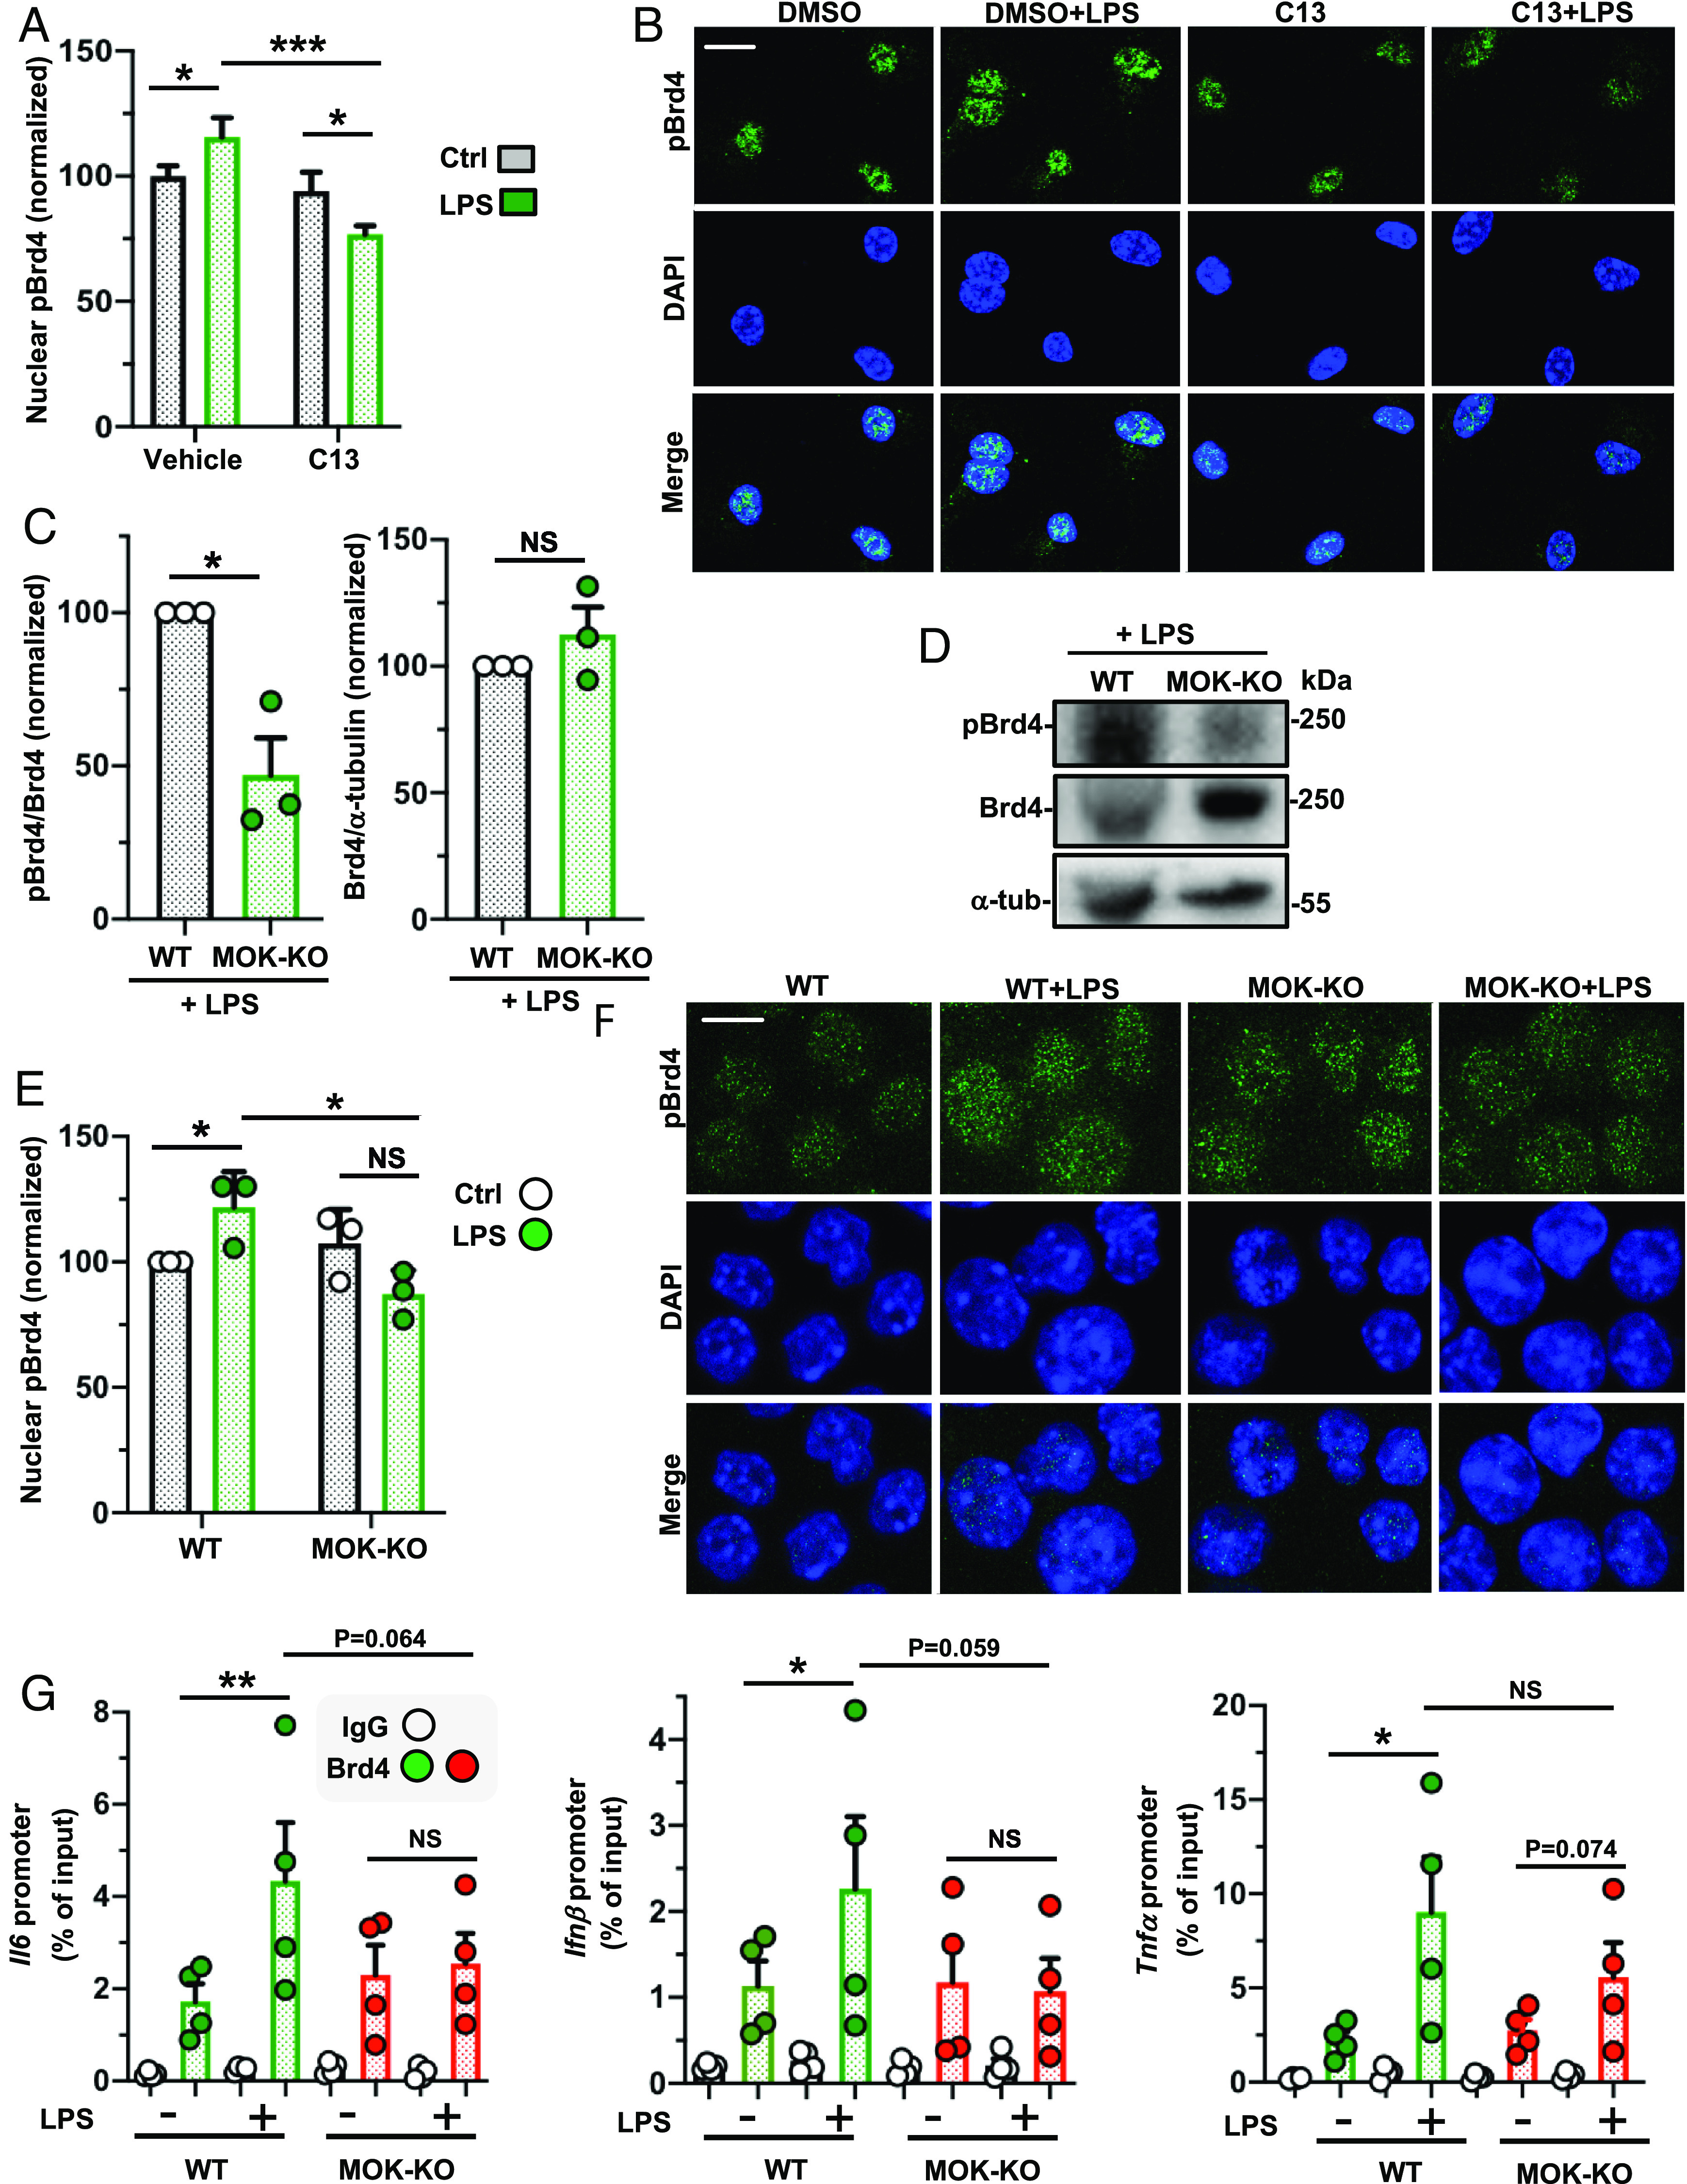
Fig. 4.

MOK regulates phospho-Ser492-Brd4 levels under neuroinflammatory conditions. (A and B) Quantification of nuclear pBrd4 levels by confocal IF with anti-pBrd4 (green) and DAPI staining of primary microglial cells pretreated with 10 µM C13 (or DMSO) for 1 h and stimulated or not with 1 µg/mL LPS for 4 h. The data and images shown correspond to one experiment (N = 20 analyzed images per condition) and are representative of two independent experiments. (Scale bar: 10 µm.) (C and D) Quantification and representative image of western blot analyses with anti-pBrd4 and anti-Brd4 (normalized to Brd4 or a-tubulin signal, respectively) in lysates of WT and MOK-KO SIM-A9 cells stimulated with 1 µg/mL LPS for 1 h. Data are from three independent experiments (N = 3). Student’s t test, unpaired, one-tailed. (E and F) Quantification and representative images of confocal IF analyses of nuclear pBrd4 levels with anti-pBrd4 (green) and DAPI staining of WT and MOK-KO SIM-A9 cells stimulated or not with 1 µg/mL LPS for 1 h. The signal was enhanced by 50% in all four images in the first row for better visualization. Images are from one out of three independent experiments (N = 3). (Scale bar: 10 µm.) Student’s t test, unpaired, two-tailed. (G) ChIP-PCR assessment of Brd4 binding to specific cytokine promoters. Represented data are relative values (percentage of input) of PCR products for Il6, Ifnβ1, and Tnfα promoters after ChIP assay with either anti-Brd4 or IgG control antibodies with chromatin isolated from WT or MOK-KO cells treated or not with 1 µg/mL of LPS for 1 h (N = 4). Student’s t test between shown groups, ratio-paired, one-tailed. Data are the mean ± SEM. from N independent experiments, and *P < 0.05, **P < 0.01 and ***P < 0.001. NS: not significant.
