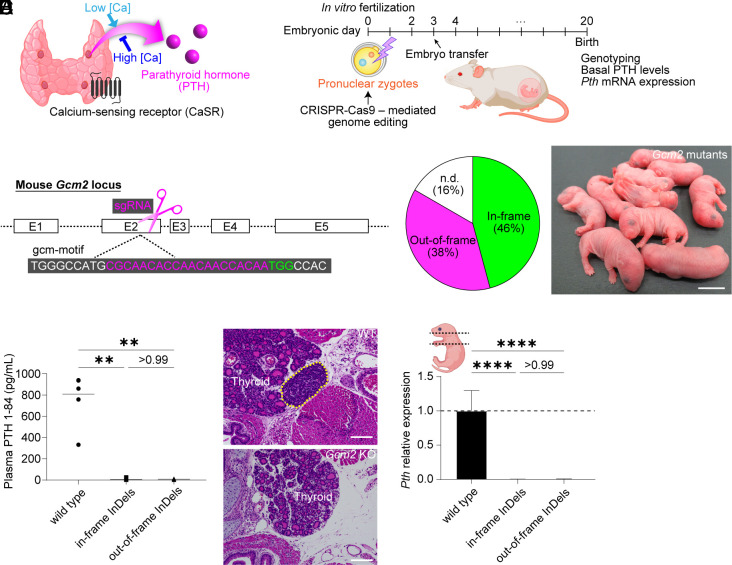
Fig. 1.
Generation and characterization of Gcm2 KO mice. (A) Schematic diagram of PTG function. (B) Zygote genome editing for generating PTG-deficient mice. (C) The target site of CRISPR-Cas9 to delete Gcm2 function. (D) Genotypes of Gcm2 mutant newborns. Those that could not be amplified by crude PCR with the mouse primer pairs were described as n.d. (E) The appearance of Gcm2 mutant pups just after birth. (Scale bar: 10 mm.) (F) Plasma PTH 1-84 levels in wild-type and Gcm2 mutant mice on B6D2F1 × C57BL/6N (BDF1B6) background at the neonatal stage. Wild type, n = 6. Gcm2 mutants with in-frame InDels, n = 11. Gcm2 mutants with out-of-frame InDels, n = 9. (G and H) Hematoxylin–eosin (HE) sections of wild-type (G) and Gcm2 mutant mice with in-frame deletion (H). The yellow dotted line indicates PTG. (Scale bars: 100 μm.) (I) Pth mRNA expression in wild-type and Gcm2 mutant neonates on BDF1B6 background. As shown in the illustration, all tissues from the neck to the mediastinum were sampled in each group. Wild type, n = 7. Gcm2 mutants with in-frame InDels, n = 5. Gcm2 mutants with out-of-frame InDels, n = 5. Graphed values, mean with s.d. **P ≤ 0.01 and ****P ≤ 0.0001, using the Kruskal–Wallis test with Dunn’s multiple comparisons test (F) and the one-way ANOVA test with Tukey’s multiple comparisons test (I).

