Fig. 3.
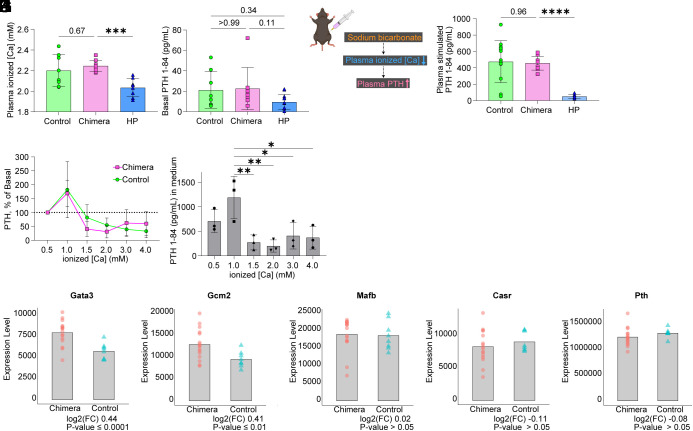
In vivo and ex vitro functional assessment of mESC-derived PTGs. (A) Plasma [Ca] in controls, Gcm2−/− mice complemented with mESCs (chimeras), and postparathyroidectomy mice. “HP” on the X axis means postparathyroidectomy mice with confirmed hypoparathyroidism. Controls, n = 8. Chimeras, n = 9. HP, n = 8. (B) Plasma basal PTH 1-84 levels in controls, Gcm2−/− mice complemented with mESCs, and postparathyroidectomy mice. Controls, n = 8. Chimeras, n = 8. HP, n = 12. (C) Schematic of sodium bicarbonate infusion test in mice. (D) Plasma stimulated PTH 1-84 levels in controls, chimeric mice, and postparathyroidectomy mice. Controls, n = 15. Chimeras, n = 9. HP, n = 8. (E) Ex vivo PTH release at different [Ca]. The PTGs were transferred from low to high calcium concentrations. Peak PTH secretion at 1.0 mM was set to 100%. Controls, n = 5. Chimeras, n = 3. (F) Ex vivo PTH 1-84 concentrations in the culture medium of PTGs generated in Gcm2−/− mice. n = 3. Same samples as (E). (G–K) Bulk RNA-seq of PTG cells. Differentially expressed gene (DEG) analysis using DESeq2. log2(FC) means fold changes of chimera gene counts against control (C57BL/6-Pthtm1(P2A-tdTomato)/+ mouse). *P ≤ 0.05, **P ≤ 0.01, ***P ≤ 0.001, and ****P ≤ 0.0001 using the Brown–Forsythe ANOVA test with Dunnett’s T3 multiple comparisons test (AD) and Kruskal–Wallis test with Dunn’s multiple comparisons test (B) and one-way ANOVA test with Šídák's multiple comparisons test (F).

