Fig. 1.
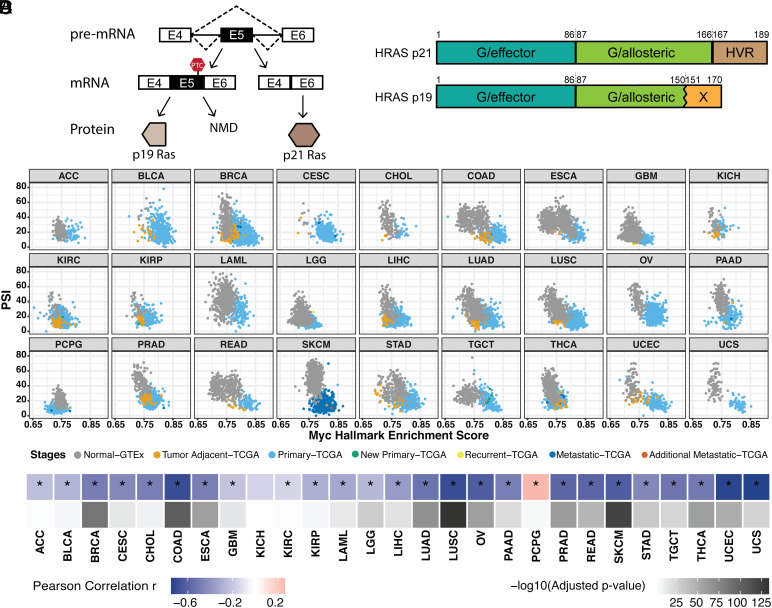
Pan-cancer analysis indicates that HRAS exon 5 is repressed by MYC activation across multiple tumor types. (A) Diagram of HRAS pre-mRNA alternative splicing. NMD, nonsense-mediated decay. (B) Domain diagram of p21 and p19 HRAS isoforms (49). G/effector, G domain/effector lobe; G/allosteric, G domain/allosteric lobe; HVR, hypervariable region. (C) Scatterplot matrix showing the correlation of HRAS exon 5 PSI with MYC hallmark enrichment score across multiple tumor types. ACC, adrenocortical carcinoma; BLCA, bladder urothelial carcinoma; BRCA, breast invasive carcinoma; CESC, cervical squamous cell carcinoma and endocervical adenocarcinoma; CHOL, cholangiocarcinoma; COAD, colon adenocarcinoma; ESCA, esophageal carcinoma; GBM, glioblastoma multiforme; KICH, kidney chromophobe; KIRC, kidney renal clear cell carcinoma; KIRP, kidney renal papillary cell carcinoma; LAML, acute myeloid leukemia; LGG, brain lower-grade glioma; LIHC, liver hepatocellular carcinoma; LUAD, lung adenocarcinoma; LUSC, lung squamous cell carcinoma; OV, ovarian serous cystadenocarcinoma; PAAD, pancreatic adenocarcinoma; PCPG, pheochromocytoma and paraganglioma; PRAD, prostate adenocarcinoma; READ, rectum adenocarcinoma; SKCM, skin cutaneous melanoma; STAD, stomach adenocarcinoma; TGCT, testicular germ cell tumors; THCA, thyroid carcinoma; UCEC, uterine corpus endometrial carcinoma; UCS, uterine carcinosarcoma. (D) Heatmap summarizing the Pearson correlation coefficient for the PSI vs. MYC score in each tumor type, accompanied by the corresponding adjusted P-value. *, tumor types with the statistically significant adjusted P-value (< 0.05).

