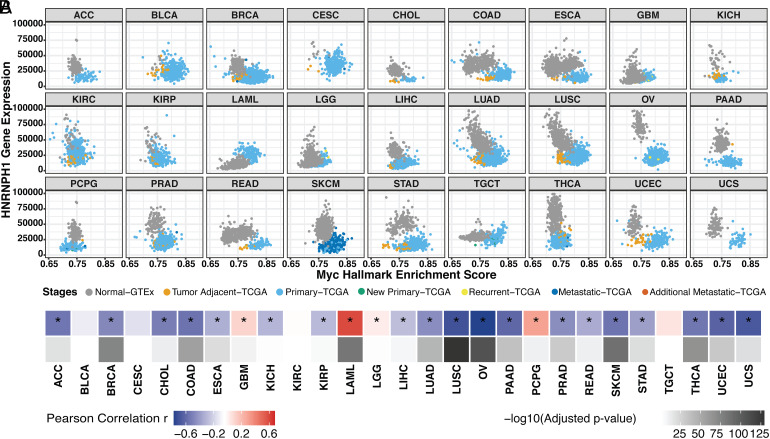
Fig. 5.
HNRNPH1 gene expression decreases with MYC activation across tumor types. (A) Scatterplot matrix showing the correlation of normalized HNRNPH1 versus MYC hallmark enrichment score across the disease spectrum in multiple tumor types. (B) Heatmap summarizing the Pearson correlation coefficient of MYC vs. HNRNPH1 expression for each tumor type, accompanied by its adjusted P-value. *, tumor types with the statistically significant adjusted P-value (< 0.05).

