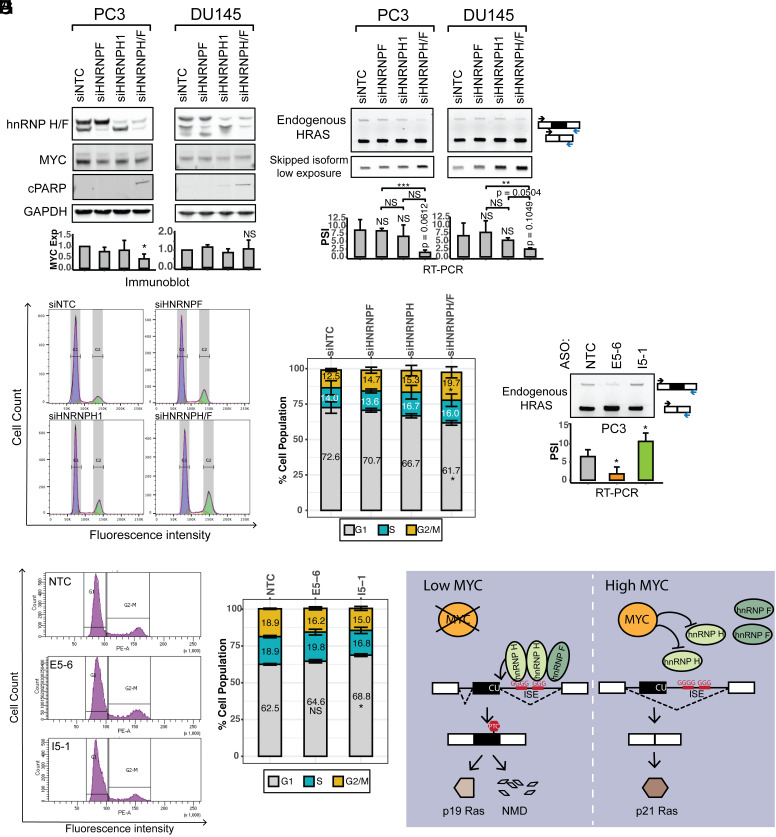
Fig. 7.
HnRNPs H and F are required for cell proliferation in prostate cancer cell lines. (A) The effects of hnRNP H and hnRNP F knockdown on the expression of MYC and the apoptosis marker cPARP in the prostate cancer cell lines, PC3 and DU145. Immunoblot showing the expression levels of hnRNPs H and F, MYC, and cPARP in cells transfected with control, HNRNPF, HNRNPH1, or HNRNPH/F siRNAs. GAPDH was used as a loading control. The bar graphs present the quantification of MYC expression in response to each siRNA perturbation, with the mean +/− SD of triplicates. (B) RT-PCR analyses showing the splicing changes of endogenous HRAS transcripts in response to each siRNA perturbation. The bar graphs show the quantification of HRAS exon 5 PSI, with the mean +/− SD of triplicates. (C) Cell cycle analysis by FACS of PC3 cells transfected with control, HNRNPF, HNRNPH1, or HNRNPH/F siRNAs, and stained with propidium iodide. (D) Stacked bar plot showing the quantification of cells in the G1, S, and G2/M phases. Bars present the mean +/− SD of triplicates. (E) RT-PCR analysis showing the splicing changes of endogenous HRAS transcripts in response to each ASO perturbation. The bar graph presents the quantification of RT-PCR results, with the mean +/− SD of triplicates. (F) Cell cycle analysis by FACS of PC3 cells transfected with nontargeting control, E5-6 and I5-1 ASOs, and stained with propidium iodide. (G) Stacked bar plot showing the quantification of cells in G1, S, and G2/M phases. Bars present the mean +/− SD of triplicates. NS: P > = 0.05; *P < 0.05; **P < 0.01; ***P < 0.001 (Student’s t-test). (H) Model of hnRNP H regulation of HRAS exon alternative splicing under low MYC versus high MYC conditions.

