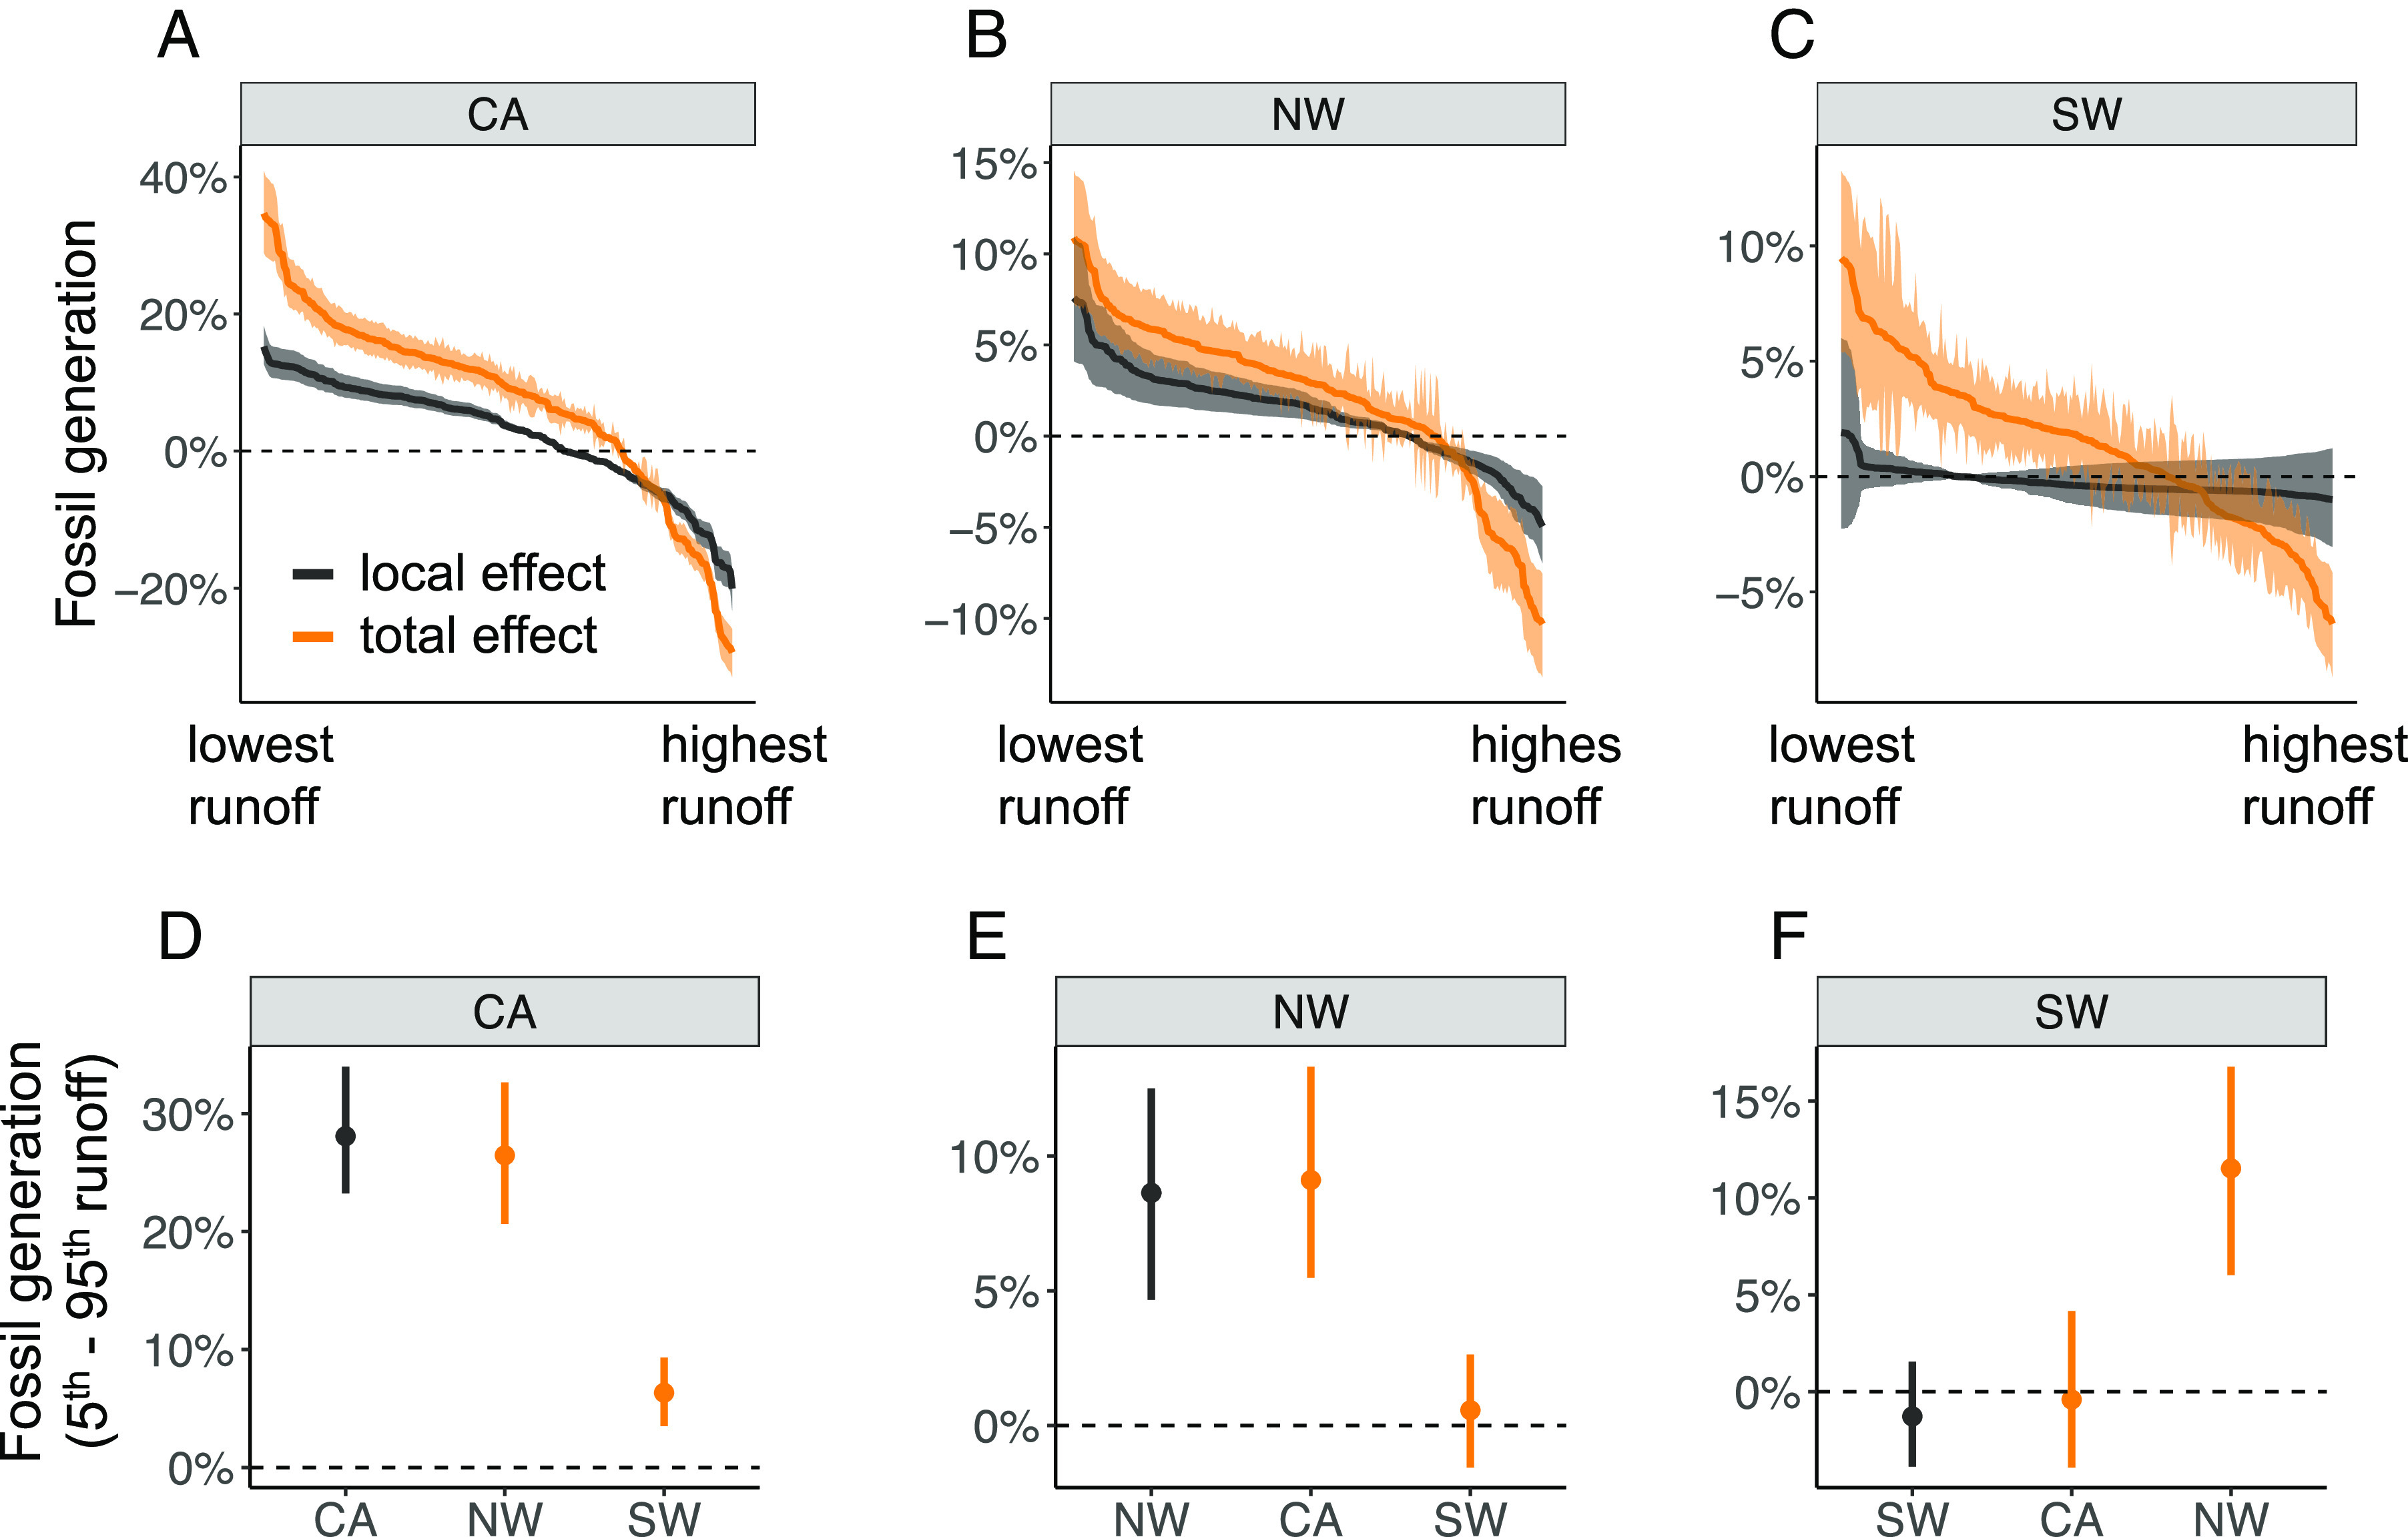
Fig. 2.

Drought increases electricity generation from fossil fuel plants with substantial transboundary effects. (A–C) Relative changes in monthly fossil generation in each region due to runoff changes in our study period. The X axis is sorted by the changes in fossil fuel generation, from months with the lowest runoff on the left to the months with the highest runoff on the right. Black lines show the “local effect” which only accounts for the impact of runoff on power plants in the same region. Orange lines show the “total effect” which accounts for the impacts resulting from runoff changes in all three regions. (D–F) Changes in fossil generation in one electricity region (each panel) due to the 5th to 95th percentile change of runoff anomalies (i.e., changes under dry conditions relative to wet conditions) in each of the three regions (x axis of each panel). The shades in panels (A–C) and error bars in (D–F) show the 95% CI of the estimated generation changes.
