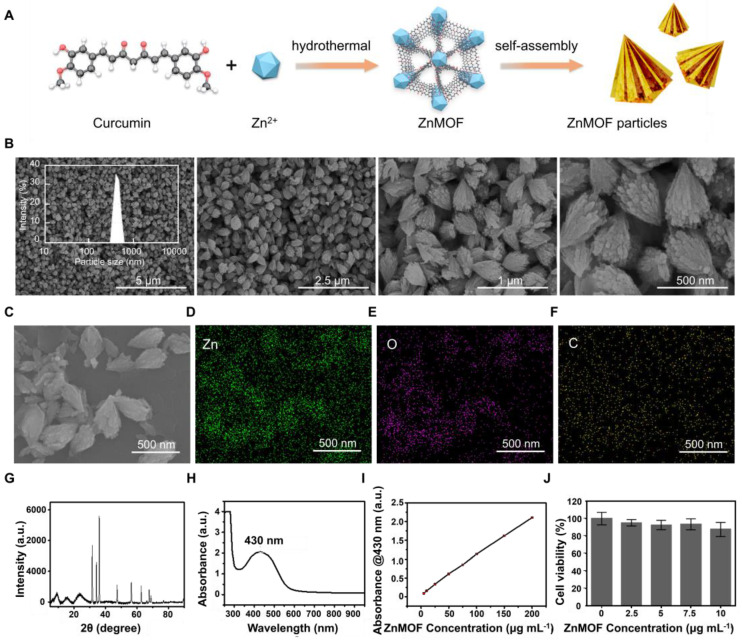
Figure 1.
Synthesis and characterization of ZnMOF. A. Schematic illustration of the synthesis of ZnMOF microsphere. B. FE-SEM image and size distribution of ZnMOF. C-F. SEM image and elemental mapping of ZnMOF. G. XRD spectra of ZnMOF powders. H. Absorption spectrum of ZnMOF. I. Absorption intensity at 430 nm with different concentrations of ZnMOF. Error bars are shown in red. J. Cell viability of DPCs treated with various concentrations of ZnMOF (0, 2.5, 5, 7.5, and 10 μg mL-1) for 48 h. No statistical significance was observed among all groups.

