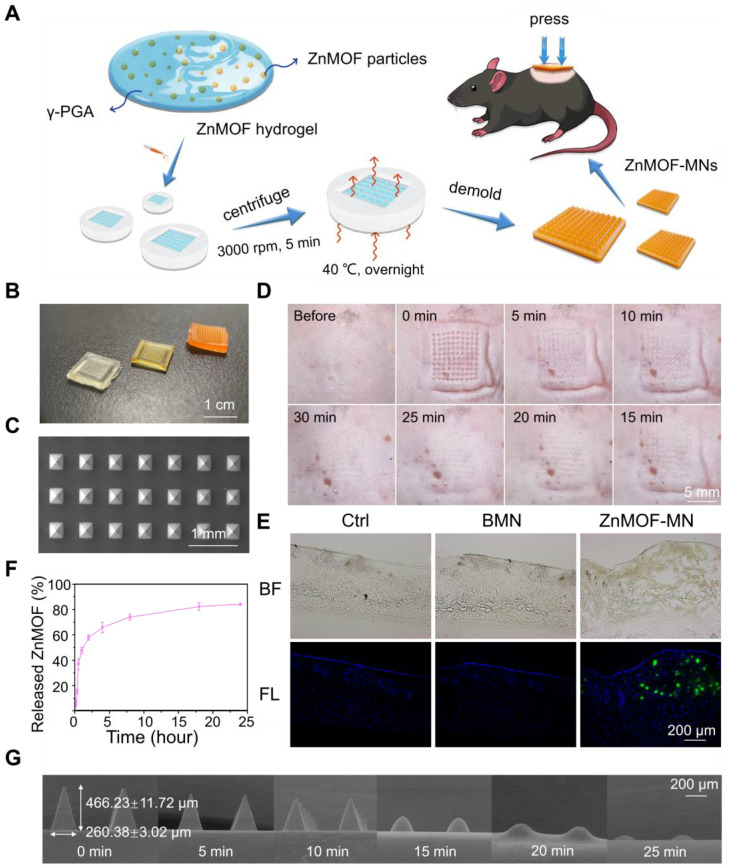
Figure 2.
Synthesis and characterization of ZnMOF-MN. A. Schematic illustration of the synthesis process of ZnMOF-MNs. B. Photographic image of MN patches (from left to right: BMN, ZnMOF-MN (0.1 mg mL-1), and ZnMOF-MN (1 mg mL-1)). C. Top-down SEM image of a patch of ZnMOF-MN. D. Recovery procedure after ZnMOF-MN penetration in the back skin of a C57BL/6 mouse. E. Brightfield (BF) and fluorescence (FL) microscopic images of untreated C57BL/6 mouse skin (the control group, Ctrl) and skin penetrated with BMN or ZnMOF-MN. ZnMOF showed green fluorescence signals. F. Release profile of ZnMOF from a ZnMOF-MN in PBS within 24 h. G. SEM images of ZnMOF-MN tips after moisture absorption at different time points (75% humidity, 25 °C). The labels revealed the detailed dimensions of the MN tips: a base diameter of 260.38 ± 3.02 μm and a height of 466.23 ± 11.72 μm.

